Yesterday, Owen Stephens asked for more details about feature importance breakdowns for each vendor by type of library.
As a caveat, please take into account the number of respondents for each group:
Talis – 6 academic
SirsiDynix – 23 academic & 33 public
III – 22 academic & 7 public
Ex Libris – 51 academic
That leaves 46 other academic and 35 other public respondents who either use a system from another supplier, or didn’t state which vendor or system they used. Their responses are included as part of the grey average bars in some of the graphs.
I might also attempt a second set of graphs to split out the Unicorn & Dynix/Horizon respondents, and the Aleph & Voyager respondents for each library type.
Finally, as with some of the other graphs, the Y axis doesn’t always start at zero. Personally I prefer to be able to concentrate on the differences in the bar heights and I tend to adjust the Y axis start value accordingly. If you prefer to see the true size of the bars (i.e. with the Y axis starting a zero), please let me know and I’ll upload new graphs.
1) Feature Importance – all 6 groups
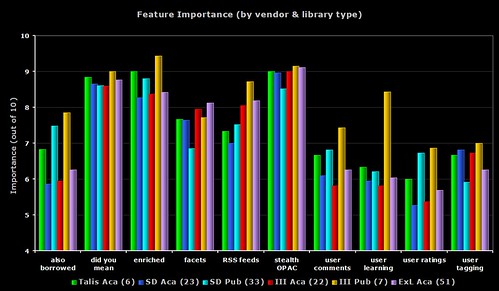
A busy graph, but one that does draw out some of the differences between all of the groups.
In 9 out of the 10 features, it’s the seven III public respondents who are giving the highest perceived importance. Only faceted browsing sees the Ex Libris academic respondents getting the highest importance rating.
With the “user learning” (i.e. OPAC that makes personalised recommendations for each user), none of the III public respondents either have the feature or are planning to implement it (even though the regard it as a relatively high importance). Four of the Ex Libris academic respondents are planning to implement the feature soon (does Primo offer this?).
2) Feature Importance – academic only

The same data as the first graph, but this time only showing the academic respondents. I count the six Talis respondents as giving the highest importance rating to 6 of the features, then Ex Libris get 3, and then 1 (user tagging) from SirsiDynix.
The Talis repsondents are all from the UK, so it’s worth remembering that (on average) the 171 UK respondents always gave lower ratings to the features than non-UK respondents. I’m going to go out on a limb here and say that I believe this is down to all of the “2.0” work and promotion Talis have been doing recently.
The grey bar shows the average from all of the 148 academic respondents.
3) Feature Importance – public only
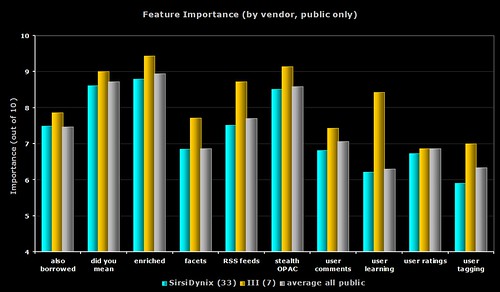
The same data as the first graph, but this time only showing the public respondents. For all 10 features, it’s the seven III respondents who give the highest ratings.
The grey bar shows the average from all of the 75 public respondents.
4) Feature Importance – SirsiDynix only
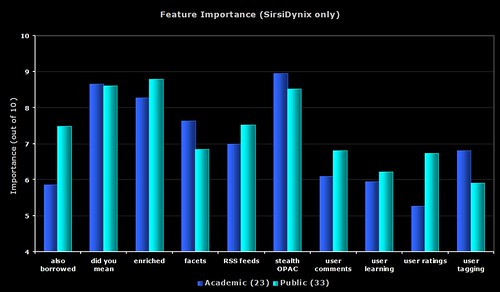
The same data as the first graph, but this time only showing the SirsiDynix respondents.
5) Feature Importance – III only
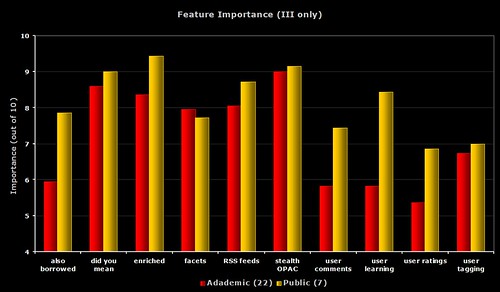
The same data as the first graph, but this time only showing the III respondents.
6) Feature Importance – each group compared to average
I’m sure you’re all getting graph fatigue (grafatigue?) now, so I’ll just give you links to the images on Flickr. Each graph shows the response from the group compared with the average from all respondents for that library type.
Talis – academic
SirsiDynix – academic
III – academic
Ex Libris – academic
SirsiDynix – public
III – public
3 thoughts on “OPAC Survey results – part 7”
Comments are closed.
Just a quick comment to say that there’ll be no more survey results for a couple of days, as I’m just about to head off to the Library & Information Show, down in Birmingham.
If you bump into to me, make sure I give you one of my Moo cards!
First, thanks for all the work you’ve put up so far.
Did you ask any questions regarding if and how respondents are tracking OPAC usage and traffic patterns; e.g. log file analysis (if so what software)or js tagging (e.g. GoogleAnalytics or other software)?
Hi John
Nope — unfortunately nothing in the survey about usage logging 🙁
Anecdotally, I know a few Horizon/Dynix sites are using Google Analytics (including us), although it doesn’t track things like keyword usage.