Being a shamistician, rather than a statistician, I’m not sure how much importance to attach to this, but I thought it was interesting enough to share!
The JISC Library Impact Data Project has given us an opportunity to churn through our usage data again and, following on from the last blog post, we’ve been looking at the statistical significance (if any!) of the correlations we’re finding in the data.
The book loan data for the last 5 years of undergrads (who graduated with a specific honour) has a small overall Pearson correlation of -0.17 (see this blog post for an explanation of why it’s negative) with a high statistical significance (p-value of 0). However, when we looked at just the 2009/10 data (which is the period the other project partners are providing data for), we found a stronger correlation (-0.20).
If we go a step further and look at the Pearson correlation each year, there appears to be a possible underlying trend at Huddersfield…
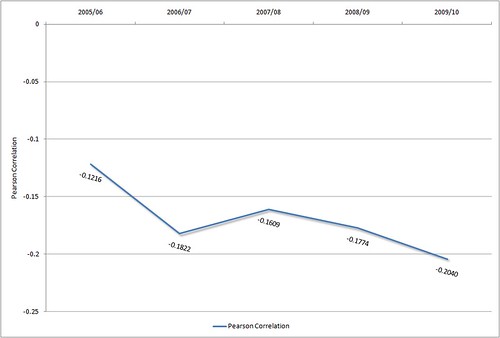
If you accept that there might be a trend there (with the Pearson correlation value increasing over time), then it raises an interesting question… are books becoming an increasingly more important part of achieving a higher grade?
Category: Library Usage & Grades
Non/low library usage and final grades
Whilst chatting to one of the delegates at yesterday’s “Gaining business intelligence from user activity data” event (my Powerpoint slides can be grabbed from here) about non & low-usage of library services/resources, I began wondering how that relates to final grades.
In the previous blog post, we’ve seen that there appears to be evidence of a correlation between usage and grades, but that doesn’t really give an indication into how many students are non/low users. For example, if we happened to know that 25% of all students never borrow anything from the library, does that mean that 25% of students who gain the highest grades don’t borrow a book?
Let’s churn the data again 🙂
In the following 3 graphs, we’re looking at:
- X axis: bands of usage (zero usage, then incremental bands of 20, then everything over 180 uses)
- Y axis: as a percentage, what proportion of the students who achieved a particular grade are in each band
You can click on the graphs to view a full-sized version.
One of the things to look for is which grade peaks in each band of usage.
Borrowing
The usage bands represent the number of items borrowed from the library during the final 3 years of study…
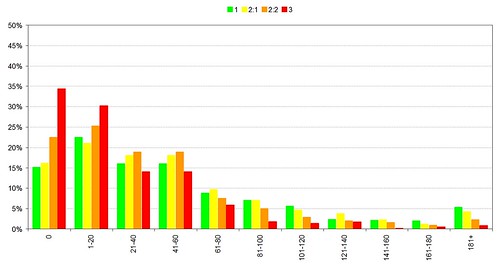
caveat: we have a lot of distance learners across the world and we wouldn’t expect them to borrow anything from the library
In terms on non-usage (i.e. never borrowing an item), there’s a marked difference between those who get the two highest grades (1 and 2:1) and those who get the lowest honours grade (3). It seems that those who get a third-class honour are twice as likely to be non-users than those who get a first-class or 2:1 degree.
E-Resource Usage
The usage bands represent the number of times the student logged into MetaLib (or AthensDA) during the final 3 years of study…
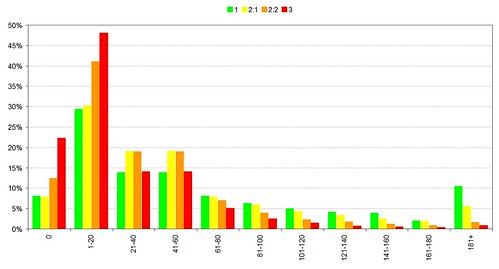
caveat: this is a relatively crude measure of e-resource usage, as it doesn’t measure what the student accessed or how long they accessed each e-resource
Even at a quick glance, we can see that this graphs tells a different story to the previous one — the numbers of non-users is lower, but there’s a huge (worrying?) amount of low usage (the “1-20” band). I can only speculate on that:
- did students try logging in but found the e-resources too difficult to use?
- how much of an impact do the barriers to off-campus access (e.g. having to know when & how to authenticate using Athens or Shibboleth) have on repeat usage?
- are students finding the materials they need for their studies outside of the subscription materials?
As I mentioned previously, Summon is a different kettle of fish to MetaLib, so it’s unlikely we’ll be able to capture comparative usage data — if you’ve tried using Summon, you’ll know that you don’t need to log in to use it (authentication only kicks in when you try to access the full-text). However, we’re confident that Summon’s ease-of-use and the work we’ve done to improve off-campus access will result in a dramatic increase in e-resource usage.
As before, we see it’s those students who graduate with a third-class honour who are the most likely to be non or low-users of e-resources.
Visits to the Library
The usage bands represent the number of visits to the library during the final 3 years of study…
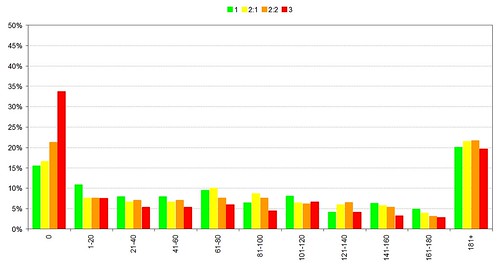
caveat: we have a lot of distance learners across the world and we wouldn’t expect them to borrow anything the the library
Again, the graph shows that those who gain a third-class degree are twice as likely to never visit the library than those who gain a first-class or 2:1.
Library usage and final grades
It’s high time I started blogging again, so let’s start off with something that my colleagues in the library have been talking about at recent conferences — the link between the usage of library services and the final academic grades achieved by students.
As a bit of background to this, it’s probably worth mentioning that we’ve had an ongoing project (since 2006?) in the library looking at non and low-usage of library resources. That project has helped identify the long term trends in book borrowing, e-resource usage and library visits by the students at Huddersfield. Plus, we’ve used that information to help identify specific courses and cohorts of students who probably aren’t using the library as much as they should be, as well as when is the most effective time during a course to do refresher training.
Towards the back end of last year, we worked with the Student Records Team to build up a profile of library usage by the previous 2 years worth of graduates. For each graduate, we compared their final degree grade with their last 3 years of library usage data — specifically:
- Items loaned — how many things did they borrow from the library?
- MetaLib/AthensDA logins — how often did they access e-resources?
- Entry stats — how many times did they venture in to the library?
Now, I’ll be the first to admit that these are basic & crude measures…
- A student might borrow many items, but maybe he’s just working his way through our DVD collection for fun.
- A login to MetaLib doesn’t tell you what they looked at or how long they used our e-resources.
- Students might (and do) come into the library for purely social reasons.
- Using the library is just one part of the overall academic experience.
…but they are rough indicators, useful for a quick initial check to see if there is a correlation. Plus, we know from the non & low-usage project that there are still many students who (for many reasons) don’t use the library much.
So, let’s churn the data! 🙂
Here’s the average usage by the 3,400 or so undergraduate degree students who graduated with an honour in the 2007/8 academic year:
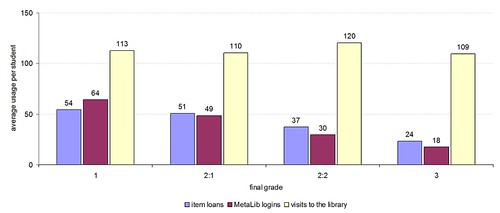
In terms of visits to the library, there’s no overall correlation — the average number of visits per student ranges from 109 to 120 — although we do seem some correlation at the level of individual courses. What does this tell us (if anything)? I’d say it’s evidence that the library is for everyone, regardless of their ability and academic prowess.
We do see a correlation with stock usage and e-resource usage. Those who achieved a first (1) on average borrowed twice as many items as those who got a third (3) and logged into MetaLib/AthensDA to access e-resources 3.5 times as much. The correlation is fairly linear across the grades, although there’s a noticable jump up in e-resource usage (when compared to stock borrowing) in those who gained a first.
Now the data for the 3,200 or students from the following academic year, 2008/9:
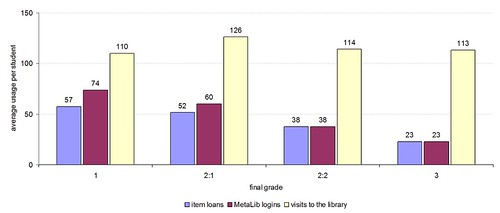
As before, no particular correlation with visits to the library, but a noticeable correlation with stock & e-resource usage. Again we see that jump in e-resource usage for those who got the highest grade.
Note too that the average usage has increased. We’ve not changed the way we measure logins or item circulation, so this is a real year-on-year growth. (Side note: as we make the move from MetaLib to Summon, the concept of an “e-resource login” will change dramatically, so we won’t be able to accurately compare year-on-year in future)
Finally, here’s both years of graduates usage combined onto a single graph:
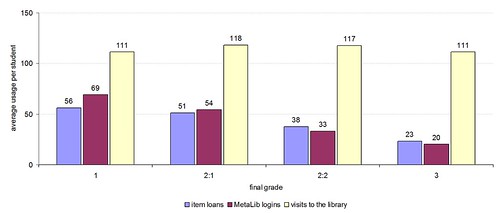
I’m curious about that jump in e-resource usage. Does it mean, to gain the best marks, students need to be looking online for the best journal articles, rather than relying on the printed page? If that is the case, will Summon have a measurably positive impact on improving grades (it certainly makes it a lot easier to find relevant articles quickly)?
Going forward, we’ve still got a lot of work to do drilling down into the data — analysing it by individual courses, looking deeper into the books that were borrowed and the e-resources that were accessed, etc. We’re also need to prove that all this has a stastical relevance. Not only that, but how can we use that knowledge and insight to improve the services which the library offers — it’d be foolish to say “borrow more books and you’ll get better grades”, but maybe we can continue to help guide students to the most relevant materials for their students.
It’s all exciting stuff and, believe me, the University of Huddersfield Library is a great environment to work in… I just wish there were more hours in the day! 🙂