Library usage and final grades

It’s high time I started blogging again, so let’s start off with something that my colleagues in the library have been talking about at recent conferences — the link between the usage of library services and the final academic grades achieved by students.
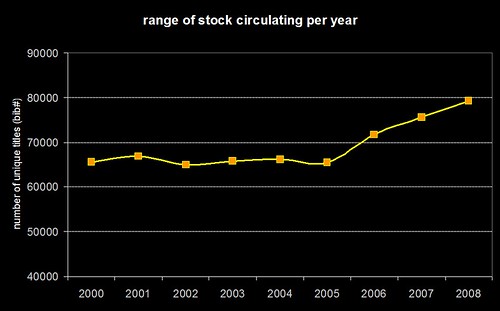
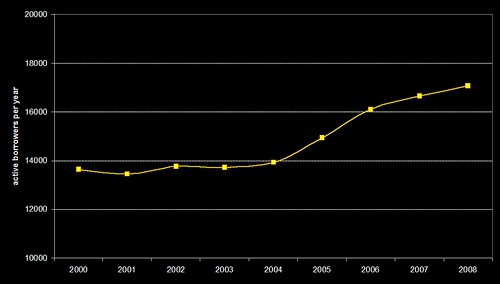
As a bit of background to this, it’s probably worth mentioning that we’ve had an ongoing project (since 2006?) in the library looking at non and low-usage of library resources. That project has helped identify the long term trends in book borrowing, e-resource usage and library visits by the students at Huddersfield. Plus, we’ve used that information to help identify specific courses and cohorts of students who probably aren’t using the library as much as they should be, as well as when is the most effective time during a course to do refresher training.
Towards the back end of last year, we worked with the Student Records Team to build up a profile of library usage by the previous 2 years worth of graduates. For each graduate, we compared their final degree grade with their last 3 years of library usage data — specifically:

  • Items loaned — how many things did they borrow from the library?
  • MetaLib/AthensDA logins — how often did they access e-resources?
  • Entry stats — how many times did they venture in to the library?

Now, I’ll be the first to admit that these are basic & crude measures…

  • A student might borrow many items, but maybe he’s just working his way through our DVD collection for fun.
  • A login to MetaLib doesn’t tell you what they looked at or how long they used our e-resources.
  • Students might (and do) come into the library for purely social reasons.
  • Using the library is just one part of the overall academic experience.

…but they are rough indicators, useful for a quick initial check to see if there is a correlation. Plus, we know from the non & low-usage project that there are still many students who (for many reasons) don’t use the library much.
So, let’s churn the data! 🙂
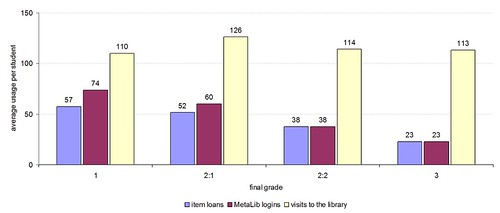
Here’s the average usage by the 3,400 or so undergraduate degree students who graduated with an honour in the 2007/8 academic year:
2007/8
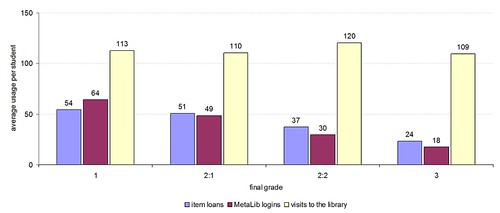
In terms of visits to the library, there’s no overall correlation — the average number of visits per student ranges from 109 to 120 — although we do seem some correlation at the level of individual courses. What does this tell us (if anything)? I’d say it’s evidence that the library is for everyone, regardless of their ability and academic prowess.
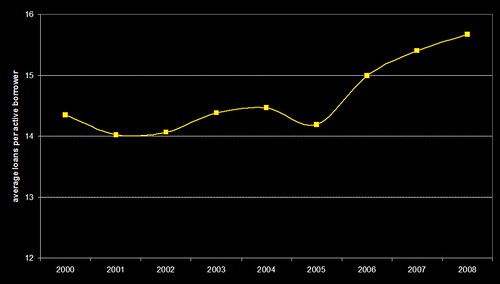
We do see a correlation with stock usage and e-resource usage. Those who achieved a first (1) on average borrowed twice as many items as those who got a third (3) and logged into MetaLib/AthensDA to access e-resources 3.5 times as much. The correlation is fairly linear across the grades, although there’s a noticable jump up in e-resource usage (when compared to stock borrowing) in those who gained a first.
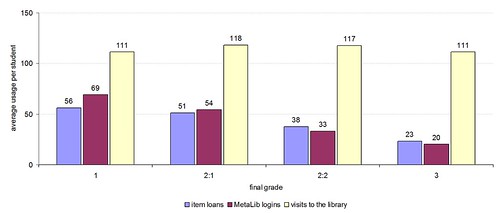
Now the data for the 3,200 or students from the following academic year, 2008/9:
2008/9
As before, no particular correlation with visits to the library, but a noticeable correlation with stock & e-resource usage. Again we see that jump in e-resource usage for those who got the highest grade.
Note too that the average usage has increased. We’ve not changed the way we measure logins or item circulation, so this is a real year-on-year growth. (Side note: as we make the move from MetaLib to Summon, the concept of an “e-resource login” will change dramatically, so we won’t be able to accurately compare year-on-year in future)
Finally, here’s both years of graduates usage combined onto a single graph:
2007/8 & 2008/9
I’m curious about that jump in e-resource usage. Does it mean, to gain the best marks, students need to be looking online for the best journal articles, rather than relying on the printed page? If that is the case, will Summon have a measurably positive impact on improving grades (it certainly makes it a lot easier to find relevant articles quickly)?
Going forward, we’ve still got a lot of work to do drilling down into the data — analysing it by individual courses, looking deeper into the books that were borrowed and the e-resources that were accessed, etc. We’re also need to prove that all this has a stastical relevance. Not only that, but how can we use that knowledge and insight to improve the services which the library offers — it’d be foolish to say “borrow more books and you’ll get better grades”, but maybe we can continue to help guide students to the most relevant materials for their students.
It’s all exciting stuff and, believe me, the University of Huddersfield Library is a great environment to work in… I just wish there were more hours in the day! 🙂

Simple API for JISC MOSAIC Project Developer Competition data

For those of you interested in the developer competition being run by the JISC MOSAIC Project, I’ve put together a quick & dirty API for the available data sets. If it’s easier for you, you can use this API to develop your competition entry rather than working with the entire downloaded data set.

edit (31/Jul/2009): Just to clarify — the developer competition is open to anyone, not just UK residents (however, UK law applies to how the competition is being run). Fingers crossed, the Project Team is hopeful that a few more UK academic libraries will be adding their data sets to the pot in early August.

The URL to use for the API is https://library.hud.ac.uk/mosaic/api.pl and you’ll need to supply a ucas and/or isbn parameter to get a response back (in XML), e.g.:

The “ucas” value is a UCAS Course Code. You can find these codes by going to the UCAS web site and doing a “search by subject”. Not all codes will generate output using the API, but you can find a list of codes that do appear in the MOSAIC data sets here.
If you use both a “ucas” and “isbn” value, the output will be limited to just transactions for that ISBN on courses with that UCAS course code.
You can also use these extra parameters in the URL…

  • show=summary — only show the summary section in the XML output
  • show=data — only show the data in the XML output (i.e. hide the summary)
  • prog=… — only show data for the specified progression level (e.g. staff, UG1, etc, see documentation for full list)
  • year=… — only show data for the specified academic year (e.g. 2005 = academic year 2005/6)
  • rows=… — max number of rows of data to include (default is 500) n.b. the summary section shows the breakdown for all rows, not just the ones included by the rows limit

The format of the XML is pretty much the same as shown in the project documentation guide, except that I’ve added a summary section to the output.
Notes
The API was knocked together quite quickly, so please report any bugs! Also, I can’t guarentee that the API is 100% stable, so please let me know (e.g. via Twitter) if it appears to be down.

Peaks and troughs in borrowing

A good couple of years ago, I blogged about “lending paths”, but we’ve not really progressed things any further since then. I still like the idea that you can somehow predict books that people might/should borrow and also when you might get a sudden rush of demand on a particular title.
Anyway, whilst heading back up north after the “Library Domain Model” workshop, I got wondering about whether we could use historical circulation data to manage the book stock more effectively.
Here’s a couple of graphs — the first is for “Strategic management: awareness and change” (Thompson, 1997) and the second is for “Strategic management: an analytical introduction” (Luffman, 1996)…


The orange bars are total number of times the book has been borrowed in that particular month. The grey bars show how many times we’d have expected the book to be loaned in that month if the borrowing for that book had followed the global borrowing trends for all stock.
Just to explain that it a little more depth — by looking at the loans for all of our stock, we can build up a monthly profile that shows the peaks and troughs throughout the academic year. If I know that a particular book has been loaned 200 times, I can have a stab at predicting what the monthly breakdown of those 200 loans would be. So, if I know that October accounts for 20% of all book loans and July accounts for only 5%, then I could predict that 40 of those 200 loans would be from October (200 x 20%) and that 10 would be from July (200 x 5%). Those predictions are the grey bars.
For both of the books, the first thing that jumps out is the disconnect between the actual (orange) number of loans in May and the prediction (grey). In other words, both books are unusually popular (when compared to all the other books in the library) in that month. So, maybe in March or April, we should think about taking some of the 2 week loan copies and changing them to 1 week loans (and then change them back in June), especially if students have had to place hold requests in previous years.


For some reason, I didn’t take any photos at the “Library Domain Model” event itself, but I did do the “tourist thing” on the South Bank…
london_021 london_019 london_037 london_024

Web service for the free book usage data

I’ve been meaning to get around to adding a web service front end on to the book usage data that we released in December for ages. So, better late than never, here it is!
It’s not the fastest bit of code I’ve ever written, but (if there’s enough interest) I could speed it up.
The web service can be called a couple of different ways:
1) using an ISBN
Examples:
a) https://library.hud.ac.uk/api/usagedata/isbn=0415014190 (“Language in the news”)
b) https://library.hud.ac.uk/api/usagedata/isbn=159308000X (“The Adventures of Huckleberry Finn”)
Assuming a match is located, data for 1 or more items will be returned. This will include FRBR style matching using the LibraryThing thingISBN data, as shown in the second example where we don’t have an item which exactly matches the given ISBN.
2) using an ID number
Examples:
a) https://library.hud.ac.uk/api/usagedata/id=125120 (“Language and power”)
The item ID numbers are included in the suggestion data and are the internal bibliographic ID numbers used by our library management system.
——————-
edit 1: I should also have mentioned that the XML returned is essentially the same format as described here.
edit 2: Ive now re-written the code as a mod_perl script (to make it faster when using ISBNs) and slightly altered the URL

Keyword search data

We’ve been logging all keyword searches on our OPAC for nearly 3 years and now have details for over 3 million searches. Just in case the data is of any use to anyone, I’ve uploaded an aggregated XML version to our web server: https://library.hud.ac.uk/data/keyworddata/
As with the usage data, we’re putting it out there with no strings attached by using an Open Data Commons Licence.
The XML file contains a list of about 8,500 keywords. For each keyword, there’s a list of other terms that have been used with that keyword in multi-term searches. The readme file contains more information about the structure.

Books that connect users

I thought it would be interesting to trawl the data and find out which books have been borrowed by the largest number of different courses within the university. I forget what the correct Graph Theory term is, but these are the books (nodes?) that connect together (edges?) the largest number of separate groups of students (networks?). The figure in brackets is the number of different courses that have borrowed the book.

  1. Questionnaire design, interviewing and attitude measurement by Oppenheim (245)
  2. Doing your research project: a guide for first-time researchers in education and social science (3rd ed) by Bell (215)
  3. Real world research: a resource for social scientists and practitioner-researchers (2nd ed) by Robson (190)
  4. Organisational behaviour and analysis: an integrated approach by Rollinson, Broadfield & Edwards (167)
  5. Sociology (3rd ed) by Giddens (161)
  6. The reflective practitioner: how professionals think in action by Schön (152)
  7. Experiential learning: experience as the source of learning and development by Kolb (150)
  8. Strategic management: awareness and change (3rd ed) by Thompson (134)
  9. Strategic management: an analytical introduction (3rd ed) by Luffman (133)
  10. Sociology: themes and perspectives (5th ed) by Haralambos & Holborn (133)
  11. Educating the reflective practitioner: toward a new design for teaching and learning in the professions by Schön (131)
  12. The good research guide: for small-scale social research projects by Denscombe (129)
  13. Qualitative data analysis: an expanded sourcebook (2nd ed) by Miles & Huberman (127)
  14. Health promotion: foundations for practice (2nd ed) by Naidoo & Wills (125)
  15. Team roles at work by Belbin (124)
  16. Research methods in education (5th ed) by Cohen, Manion & Morrison (124)
  17. How to research by Blaxter, Hughes & Tight (124)
  18. Understanding organizations (4th ed) by Handy (123)
  19. Basics of qualitative research: techniques and procedures for developing grounded theory (2nd ed) by Strauss & Corbin (121)
  20. The study skills handbook by Cottrell (120)
  21. Health promotion: models and values (2nd ed) by Downie, Tannahill & Tannahill (120)
  22. Doing qualitative research: a practical handbook by Silverman (116)
  23. Marketing by Lancaster & Reynolds (116)
  24. Reflection: turning experience into learning by Boud, Keogh & Walker (113)
  25. Management (6th ed) by Stoner, Freeman & Gilbert (109)
  26. No sweat!: the indispensable guide to reports and dissertations by Irving & Smith (109)
  27. The good study guide by Northedge (106)
  28. Research methods for nurses and the caring professions (6th ed) by Abbott & Sapsford (106)
  29. Marketing by Lancaster & Reynolds (106)
  30. Operations and the management of change by Gilgeous (106)

Conversely, these are the books that have only ever been borrowed by students on one specific course. The figure in brackets is the number of loans.

  1. The meaning of everyday occupation by Hasselkus (61)
  2. Perspectives in human occupation: participation in life by Kramer, Hinojosa & Royeen (48)
  3. Introduction to podopediatrics (2nd ed) by Thomson & Volpe (42)
  4. Occupational therapy without borders: learning from the spirit of survivors by Algado, Pollard & Kronenberg (38)
  5. Transformation through occupation by Watson & Swartz (38)
  6. Operating department practice A-Z by Smith & Williams (31)
  7. Lully, lulla, thou little tiny child: for soprano solo and SATB (unaccompanied), op.25 no.2 by Leighton (31)
  8. Five childhood lyrics: for unaccompanied mixed voices by Rutter (31)
  9. Task analysis: an occupational performance approach by Watson & Llorens (30)
  10. Conditions in occupational therapy: effect on occupational performance (3rd ed) by Atchison & Dirette (30)

The impact of serendipity (part 2)

I promised I’d dig a bit deeper into the book data, so here goes!
We have seven academic schools in the university, so I thought it would be interesting to see how the range of titles broke down by each school. As previously noted, the borrowing patterns seem to have changed at the end of 2005/start of 2006, so here’s the percentage change for the two periods…

academic school       average range of titles borrowed    % change
                            2000-2005        2006-2008
Music, Humanities & Media      16,760           20,468      122.1%
Business                        9,431           11,402      120.9%
Computing & Engineering         7,033            6,771       96.3%
Education                      12,485           11,909       95.4%
Human & Health Sciences        16,427           20,274      123.4%
Applied Sciences                7,356            7,562      102.8%
Art, Design & Architecture      9,361           12,309      131.4%

So, first of all, the increase in range of titles being borrowed isn’t across the board. I knew Computing & Engineering borrowing had been in decline for a number of years, but I’m surprised to see that the same applies for Education. Applied Sciences has stayed pretty much the same, but the other 4 schools have seen sizeable increases in the range of titles being borrowed.
The Art & Design section of the library was revamped in 2005, so it could be that we’ve seen an increase in the number of students using the library and that has driven the increased borrowing since then for that school.
A few of the comments suggested that loans per borrower would be a useful metric. Unfortunately I don’t have the data for the total number of students in each school per year, so I’m using the total number of active borrowers instead…

academic school      average loans per active borrower    % change
                            2000-2005        2006-2008
Music, Humanities & Media        26.1             25.7       98.6%
Business                         10.2             12.3      121.4%
Computing & Engineering           8.3              7.7       93.6%
Education                        15.1             14.0       92.8%
Human & Health Sciences          15.3             18.8      122.6%
Applied Sciences                 11.8             13.3      112.1%
Art, Design & Architecture       10.6             10.4       98.4%

Again a decline in Computing and Education. Art & Design and Music & Humanities have remained pretty much the same. The other 3 schools have seen an increase in the number of loans per active borrower.
One final set of data — the number of active borrowers per school…

academic school    average active borrowers per school    % change
                                2000-2005    2006-2008
Music, Humanities & Media           1,537        1,976      128.5%
Business                            2,557        2,963      115.8%
Computing & Engineering             1,650        1,527       92.5%
Education                           1,526        1,988      130.3%
Human & Health Sciences             3,587        4,581      127.7%
Applied Sciences                    1,267        1,243       98.1%
Art, Design & Architecture          1,621        2,332      143.9%

It looks like there are a couple of things going on here…
1) In the last 3 years, the number of active borrowers (i.e. users who have borrowed at least one item) has increased. In the period 2000-2004, the total number of active student borrowers was relatively static (around 14,000) and since 2005 it’s been on the increase (with just over 17,000 in 2008).
2) Overall, there’s an increase in the average number of books borrowed per active borrower, primarily driven by the two schools with the highest number of active borrowers (Business and Human & Health). The increases in those two schools more than offsets the decreases seen in a couple of the other schools (Computing and Education).
At a time when some other UK academic libraries have reported a decrease in borrowing, both of the above are good news for our library. I’ll need to go back to the SCONUL stats to check, but I don’t think we’ve seen much of an increase in book stock in the last decade (I suspect it might actually have decreased).
So, can we actually say anything about the impact of serendipity? If we look in more depth at the average number of books borrowed per active borrower per year for all students, we get this…
loansperactiveborrower
…which closely resembles the original graph from the first post showing the range of unique titles borrowed per year…
interesting
…and the number of active borrowers per year also shows a similar trend…
activeborrowers
It’s obvious that there’s a driver in there somewhere which has caused the average number of loans per active borrower to increase since 2005. Hand-in-hand there’s been a similar increases in the range of stock that’s being borrowed and the number of active borrowers.
As more people use the library, one would perhaps expect the range of stock being borrowed to increase. However, would you also expect the average number of loans per borrower to increase (bearing in mind that the stock levels have probably not increased and may have actually decreased during that period)?
I’m still not entirely sure I’ve shown that adding serendipity to an OPAC increases the range of stock being borrowed (that’s probably more influenced by the number of active borrowers), but there may well be a link with the average number of books loaned to each borrower.
Now, to change the topic, here’s one final graph that I included in the UKSG presentation — it shows the number of clicks per month on the books in the OPAC’s virtual shelf browser
virtualshelfbrowser
…seeing as this was just an experimental feature that added a bit of “book cover eye candy” to the OPAC, I’m amazed how heavily it’s being used. Whilst fixing one of our dedicated catalogue PCs in the library on Friday, I noticed that a student was carrying out a search, then picking a relevant search result, then using the shelf browser to look at all of the nearby books. And to think I’m usually dismissive of the benefits of browsing within OPACs 😀

A library dating service

In my UKSG presentation, I briefly touched on the need for library services (perhaps the OPAC, but perhaps not) to start joining users together in the same way that sites like Facebook do.
In the same way that a “people who borrowed this, also borrowed…” service starts exposing the hidden links between items on shelves, I think we need to start finding the connections between our users.
Using circulation data, we can start to locate clusters of users who’ve borrowed the same books. In an academic environment, these may be students who are studying on the same course. However, what if we discovered that two separate courses being run in different parts of the university had a strong overlap in borrowing? Would value be gained from introducing those students to each other?
No sooner had I tweeted that I was thinking about this kind of thing, Tony Hirst sent a response

…a library dating service, then? Heh heh 😉

I’m keen to know what your first reaction to Tony’s comment is!
What if you were a lonely researcher who wanted to find someone similar to yourself, in order to collaborate on a project? By mining the circulation data and/or OpenURL article access data, a library could find your ideal partner — someone who’d been looking at the same books and resources that you’d been using. If libraries were aggregating their usage data at a national level, that perfect partner could well be a researcher at another institution.
To test this out, I tweaked our “people who borrowed this” code to generate the links between users (rather than the books). As an aside, I’ve been trying all day to figure out what the user equivalent of “people who borrowed this, also borrowed…” is, but haven’t been able to wrap my head around the logical linguistics of it!
Data Protection obviously means that I can share that prototype with you, but it did throw up some interesting results. For my partner Bryony, her closest match was one of her colleagues who works in the same department as her — they both share similar craft related interests, so have borrowed similar books. However, what if her closest match was someone working in another department? Maybe they’d want to meet up over a coffee and swap crafty ideas.
I also tried the same for one of my colleagues, who’s a lecturer, and found that his ideal match is himself! Or rather, the closest match for his current library account (as a member of staff) was his old library account from when he was a student. In other words, since becoming a lecturer, he’s re-borrowed quite a few of the books he used as a student.
Although I can’t show you the data for individuals, we can step back a level and look at the borrowing at the course level. I’ve put together a quick and dirty prototype to play with. The prototype will pick a course at random and then show the courses that have the closest matches in terms of book borrowing — if you’re unlucky and get an empty list (i.e. no matches were found), try refreshing the page.
Taking the BSC Applied Criminology course as an example — 59.3% of the books borrowed by students on that course were also borrowed by students on the BSC Behavioural Sciences course (HB100). The other top matches all seem to be related to criminology: psychology, social work, police studies, child protection, probation work, etc. However, there also appears to be some synergy with books borrowed by midwifery, history and hospitality management students.
I’ll try and add some extra code in tomorrow to show what the most popular books are that inhabit those course intersections.

The impact of book suggestions/recommendations?

Whilst finalising my presentation for the 2009 UKSG Conference in Torquay, I thought it would be interested to dig into the circulation data to see if there was any indication that our book recommendation/suggestion services (i.e. “people who borrowed this, also borrowed…” and “we think you might be interested in…”) have had any impact on borrowing.
Here’s a graph showing the range of stock that’s being borrowed each calendar year since 2000…
interesting
Just to be clear — the graph isn’t showing the total number of items borrowed, it’s the range of unique titles (in Horizon speak, bib numbers) that have been borrowed. If you speak SQL, then we’re talking about a “count(distinct(bib#))” type query. What I don’t have to hand is the total number of titles in stock for each year, but I’d hazard a guess that it’s been fairly constant.
You can see that from 2000 to 2005, borrowing seems to have been limited to a range of around 65,000 titles (probably driven primarily by reading lists). At the end of 2005, we introduced the “people who borrowed this, also borrowed…” suggestions and then, in early 2006, we added personalised “we think you might be interested in…” suggestions for users who’ve logged into the OPAC.
Hand on heart, I wouldn’t say that the suggestions/recommendations are wholly responsible for the sudden and continuing increase in the range of stock being borrowed, but they certainly seem to be having an impact.
Hand-in-hand with that increase, we’ve also seen a decrease in the number of times books are getting renewed (even though we’ve made renewing much easier than before, via self-issue, telephone renewals, and pre-overdue reminders). Rather than hanging onto a book and repeatedly renewing it, our students seem to be exploring our stock more widely and seeking out other titles to borrow.
So, whilst I don’t think there’s a quick any easy way of finding out what the true impact has been, I’m certainly sat here with a grin like a Cheshire cat!

3 Million

Aaron’s cool Wordle visualisations prompted me to have a look at our ever growing log of OPAC keyword searches (see this blog post from 2006). We’ve been collecting the keyword searches for just over 2.5 years and, sometime within the last 7 days, the 3 millionth entry was logged.
Not that I ever need an excuse to play around with Perl and ImageMagick, but hitting the 3 million mark seemed like a good time to create a couple of images…
file6_good
file7_good
The only real difference between the two is the transparency/opacity of the words. In both, the word size reflects the number of times it has been used in a search and the words are arranged semi-randomly, with “a”s near the top and “z”s near the bottom.
If I get some spare time, it’ll be interesting to see if there are any trends in the data. For example, do events in the news have any impact on what students search for?
The data is currently doing a couple of things on our OPAC
1) Word cloud on the front page, which is mostly eye candy to fill a bit of blank space
2) Keyword combination suggestions — for example, search for “gothic” and you should see some suggestions such as “literature”, “revival” and “architecture”. These aren’t suggestions based on our holdings or from our librarians, but are the most commonly used words from multi keyword searches that included the term “gothic”.
..and, just for fun, here’s the data as a Wordle:
wordle2
wordle1