Whilst chatting to one of the delegates at yesterday’s “Gaining business intelligence from user activity data” event (my Powerpoint slides can be grabbed from here) about non & low-usage of library services/resources, I began wondering how that relates to final grades.
In the previous blog post, we’ve seen that there appears to be evidence of a correlation between usage and grades, but that doesn’t really give an indication into how many students are non/low users. For example, if we happened to know that 25% of all students never borrow anything from the library, does that mean that 25% of students who gain the highest grades don’t borrow a book?
Let’s churn the data again 🙂
In the following 3 graphs, we’re looking at:
- X axis: bands of usage (zero usage, then incremental bands of 20, then everything over 180 uses)
- Y axis: as a percentage, what proportion of the students who achieved a particular grade are in each band
You can click on the graphs to view a full-sized version.
One of the things to look for is which grade peaks in each band of usage.
Borrowing
The usage bands represent the number of items borrowed from the library during the final 3 years of study…
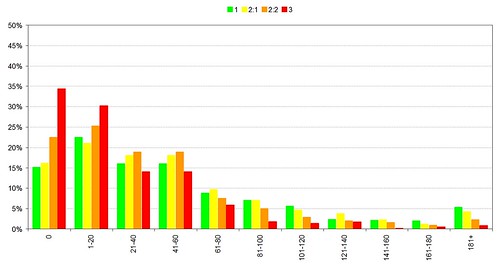
caveat: we have a lot of distance learners across the world and we wouldn’t expect them to borrow anything from the library
In terms on non-usage (i.e. never borrowing an item), there’s a marked difference between those who get the two highest grades (1 and 2:1) and those who get the lowest honours grade (3). It seems that those who get a third-class honour are twice as likely to be non-users than those who get a first-class or 2:1 degree.
E-Resource Usage
The usage bands represent the number of times the student logged into MetaLib (or AthensDA) during the final 3 years of study…
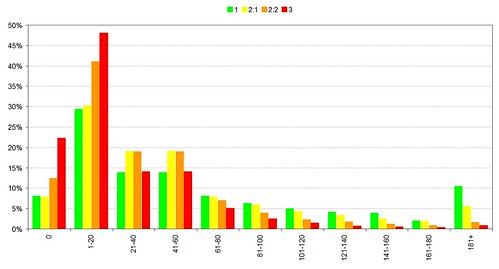
caveat: this is a relatively crude measure of e-resource usage, as it doesn’t measure what the student accessed or how long they accessed each e-resource
Even at a quick glance, we can see that this graphs tells a different story to the previous one — the numbers of non-users is lower, but there’s a huge (worrying?) amount of low usage (the “1-20” band). I can only speculate on that:
- did students try logging in but found the e-resources too difficult to use?
- how much of an impact do the barriers to off-campus access (e.g. having to know when & how to authenticate using Athens or Shibboleth) have on repeat usage?
- are students finding the materials they need for their studies outside of the subscription materials?
As I mentioned previously, Summon is a different kettle of fish to MetaLib, so it’s unlikely we’ll be able to capture comparative usage data — if you’ve tried using Summon, you’ll know that you don’t need to log in to use it (authentication only kicks in when you try to access the full-text). However, we’re confident that Summon’s ease-of-use and the work we’ve done to improve off-campus access will result in a dramatic increase in e-resource usage.
As before, we see it’s those students who graduate with a third-class honour who are the most likely to be non or low-users of e-resources.
Visits to the Library
The usage bands represent the number of visits to the library during the final 3 years of study…
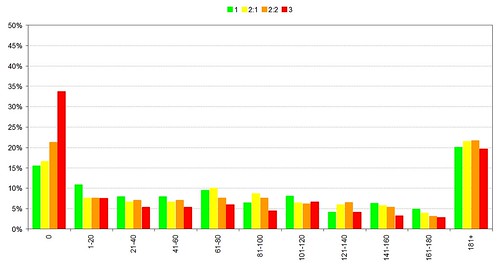
caveat: we have a lot of distance learners across the world and we wouldn’t expect them to borrow anything the the library
Again, the graph shows that those who gain a third-class degree are twice as likely to never visit the library than those who gain a first-class or 2:1.