
You can grab a copy of my presentation (“I wouldn’t start from here”) from daveyp.com/files/stuff/uksg2012/ (PDF or PPTX).
Claire Gravely wrote up a summary of the session for the UKSG blog.
Unfortunately it looks like I’ve managed to lose the USB stick with the final version of the presentation, so the above is the closest version I could find on my netbook. I’ve snipped out about 25 slides of screenshots that showed an e-resource problem reported by a student and the fun & games I had trying to get to the full-text (which ended with me being asked to pay $59) — the purpose wasn’t to single out any specific vendor or platform for criticism, but to show an example of just how painful the end user experience can be when compared to Google.
After uploading it, I released I’d forgotten to include explicit CC info. Feel free to treat the original content as being CC BY-SA.
The PowerPoint file was too big for SlideShare, so I’ve uploaded the PDF version with notes instead…
Category: Events
Quick idea from #jisclms event
A mega quick blog post before the afternoon session kicks off!
Lynn Connaway‘s talk mentioned that they’d found that students wanted the library/librarian to provide a filtered feed of relevant stuff, so here’s our idea…
1) capture OpenURL usage data along with user data (so you know who’s looking at which journals)
2) identify the most popular journals for individual courses
3) for each course, use TicTOCs/JournalTOCs to provide an aggregated feed of new articles for those journal
Mashed Library 2010 – MashSpa in Bath!
The booking form for the next Mashed Library event — MashSpa (aka “Mash and Mashibility”) in Bath on 29th October — is now live!
Event site: http://blogs.ukoln.ac.uk/mashspa/
Booking form: https://library.hud.ac.uk/mashspa/

Mashed Library 2010 – Chips and Mash
I promise that one of these days I’ll get back into regular blogging (honest!)
After “Liver and Mash” at Liverpool, it looked likely that there might not be another Mashed Library event in 2010. So, after a bit of a natter with colleagues, we’ve decided to host another event at Huddersfield (with even more cake than last time!)…
Chips and Mash
- When? Friday 30th July (10am to 4pm)
- Where? University of Huddersfield, West Yorkshire, HD1 3DH
- Event blog http://chipsandmash.wordpress.com/
- Registration form https://library.hud.ac.uk/chipsandmash/
- Cost absolutely free!
- Sponsor Intellident Ltd
Mashed Library 2010 – Liverpool
As announed on Twitter last night, the first Mashed Library UK event of 2010 will be taking place in Liverpool on Friday 14th May 🙂
Keep an eye on the following sites for further details!

It’s become a little tradition to give each event a fun name — we’ve had “Mash Oop North!” (Huddersfield) and “Middlemash” (Birmingham). If you’ve got any suggestions for the Liverpool event, please tweet them to @m8nd1 or @daviddclay, or leave a comment here 🙂
Some (Beatles related) suggestions are:
- A Hard Day’s Mash
- All You Need is Mash
- Sgt Masher’s Mashtastical Mashup Band
- All Things Must Mash
- Mash Me Do
- Eight Mashups a Week
- I Am the Mashup
- Mashups (That’s What I Want)
- I’m API Just to Dance With You
Mashed Library 2009 — Middlemash
Just a quick “heads-up” that the second Mashed Library event of 2009 (“Middlemash”) takes place at Birmingham City University on Monday 30th November.
The registration form should be going live The registration form went live on Tuesday morning and I’m sure it’ll be another sell-out event — keep a close eye on the event blog for further details 🙂

If you can’t make it to Birmingham in November, then keep an eye on the Mashed Library Wiki for details of the next event, which will hopefully take place at the University of Liverpool in early 2010. Many thanks to David Clay for offering to host the event!
ILI 2009 Presentation
I really struggled to shoehorn everything I wanted to talk about during my ILI 2009 presentation into the slides, so this blog post goes into a bit more depth than I’ll probably talk about…
slide 1 & 2


I’m still in two minds about whether or not the word “exploit” has too many negative connotations, but what the heck!
If you do use any of the content from the presentation, please drop me an email to let me know 🙂
slide 3

As part of the development of the UK version of Horizon back in the early 1990s, libraries requested that the company (Dynix) add code to log all circulation transactions. Horizon was installed at Huddersfield in 1996 and has been logging circulation data since then. At the time of writing this blog post, we’ve got data for 3,157,111 transactions.
slide 4

With that volume of historical data, it seemed sensible to try and create some useful services for our students. In November 2005, we started dabbling with an Amazon-style “people who borrowed this” service on our OPAC. After some initial testing and tweaking, the service went fully live in January 2006. The following month, we added a web service API (named “pewbot”).
To date, we’ve had over 90,000 clicks on the “people who borrowed this, also borrowed…” suggestions, with a peak of 5,229 clicks in a single month (~175 clicks per day). Apart from the “Did you mean?” spelling suggestions, this has been the most popular tweak we’ve made to our OPAC.
slide 5

Because we’re an academic library, we get peaks and troughs of borrowing throughout the academic year. The busiest times are the start of the new academic year in October and Easter.
slide 6

If you compare the number of clicks on the “people who borrowed this, also borrowed..” suggestions, you can see that it’s broadly similar to the borrowing graph, except for the peak usage. Due to the borrowing peak in October, in November a significant portion of our book stock will be on loan. When our students find that they books they want aren’t available, they seem to find the suggestions useful.
I’m hoping to do some analysis to see if there’s a stronger correlation between the suggested books that are clicked on and then borrowed on the same day during November than during the other months.
slide 7
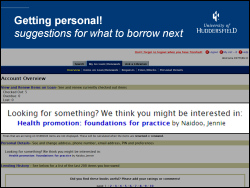
Once a user logs into the OPAC, we can provide a personal suggestion by generating the suggestions for the books they’ve borrowed recently and then picking one of the titles that comes out near the top.
slide 8
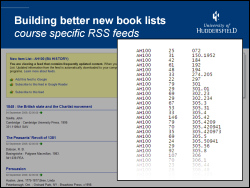
I was originally asked to come up with some code to generate new book lists for each of our seven academic schools. It turned out to be extremely hard to figure out which school a book might have been purchased for, so I turned to the historical book circulation data to come up with a better method.
Rather than having a new book list per school, we’re now offering new book lists per course of study.
The way it’s done is really simple — for each course, we analyse all of the books borrowed by students on that course and then automatically build up a Dewey lending profile. Whenever a new book is added to our catalogue, we check to see which courses have previously borrowed heavily from that Dewey class and then add the book details to their feeds.
The feeds are picked up by the University Portal, so students should see the new book list for their course and (touch wood!) the titles will be highly relevant to their studies.
slide 9
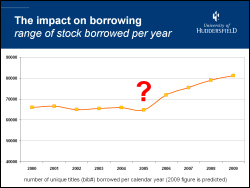
One of the comments I frequently hear is that book recommendation services might create a “vicious circle” of borrowing, with only the most popular books being recommended. At Huddersfield, we’ve seen the opposite — since adding recommendations and suggestions, the range of stock being borrowed has started to widen.
From 2000 to 2005, the range of titles being borrowed per year was around 65,000 (which is approximately 25% of the titles held by the library). Since adding the features in early 2006, we’ve seen a year-on-year increase in the range of titles being borrowed. In 2009, we expect to see over 80,000 titles in circulation, which is close to 33% of the titles held by the library.
I strongly believe that by adding serendipity to our catalogue, we’re seeing a very positive trend in borrowing by our students.
slide 10

Not only are students borrowing more widely than before, they’re also borrowing more books than before. From 2000 to 2005, students would borrow an average of 14 books per year. In 2009, we’re expecting to see borrowing increase to nearly 16 books per year. We’re also seeing a year-on-year decrease in renewals — rather than keeping hold of a book and renewing it, students seem to be returning items sooner and borrowing more than ever before.
slide 11

We’re also logging keyword searches on the catalogue — since 2006, we’ve logged over 5 million keyword searches and it’s fun looking at some of the trends.
As we had a bit of dead space on the OPAC front page, we decided to add some “eye candy” — in this case, it’s a keyword cloud of the most popular search terms from the last 48 hours. Looking at the usage statistics, we’re seeing that new students find the cloud a useful way of starting their very first search of the catalogue, with the usage in October nearly twice that of the next highest month.
slide 12

A much more useful service that we’ve built from the keywords is one that suggests good keywords to combine with your current search terms.
In the above example, we start with a general search for “law” which brings back an unmanageable 7000+ results. In the background, the code quickly searches through all of the previous keyword searches that contained law and pulls together the other keywords that are most commonly used in multi-keyword searches that included “law”. With a couple of mouse clicks, the user can quickly narrow the search down to a manageable 34 results for “criminal law statutes“.
There’re two things I really like about this service:
1) I didn’t have to ask our librarians to come up with the lists of good keywords to combine with other keywords — they’ve got much more important things to do with their time 🙂
2) The service acts as a feedback loop — the more searches that are carried out, the better the suggestions become.
slide 13

I forget exactly how this came about (but I suspect a conversation with Ken Chad sowed the initial seed), but we decided to release our circulation and recommendation data into “the wild” in December 2008 — see here for the blog post and here for the data.
The data was for every item that has an ISBN in the bibliographic record, as we felt than the ISBN would be the most useful match point for mashing the data up with other web services (e.g. Amazon).
We realised that we’d need to use a licence for the data release and, after a brief discussion with Ken Chad, it became increasingly obvious that a Public Domain licence was the most appropriate. Accordingly, the data was released under a joint Open Data Commons and (partly because we couldn’t decide which licence was the best one!). In other words, we wanted it to be really clear that there were “no strings” attached to how the data could be used.
slide 14

Within a couple of days of releasing the data, Patrick Murray-John at the University of Mary Washington had taken it and “semantified” the data.
A few weeks later, I had the privilege of chatting to Patrick and Richard Wallis when we took part in a Talis Podcast about the data release.
slide 15

My great friend Iman Moradi (formerly a lecturer at Huddersfield and now the Creative Director of Running in the Halls) used some of the library data as part of the Multimedia Design course.
slides 16 & 17


Iman’s students used the library data to generate some really cool data visualisations — it was really hard to narrow them down to just two images for the ILI presentation. The second image made me think of Ranganathan‘s 5th Law of Library Science: “The library is a growing organism” 🙂
slide 18

The JISC funded MOSAIC Project (Making Our Shared Activity Information Count), which followed on from the completed TILE Project, is exploring the benefits that can be derived from library usage and attention data.
Amongst the goals of the project are to:
- Encourage academic libraries to release aggregated/anonymised usage data under an open licence
- Develop a prototype search engine capable of providing course/subject specific relevancy ranked results
The prototype search engine is of particular interest, as it uses the pooled usage/attention data to rank results so that the ones which are more relevant to the student (based on their course) are boosted. For example, if a law student did a search for “ethics”, books on legal ethics would be ranked higher than those relating to nursing ethics, ethics in journalism, etc. This is achieved by deep analysis of the behaviour of other law students at a variety of universities.
slide 19

The MOSAIC Project is also encouraging the developer community to engage with the usage data, and this included sponsorship of a developer competition.
they
slides 20 & 21


It was hard to pick which competition entries to include in the presentation, so I just picked a couple of them at random. The winning entry, and the two runners up, should be announced shortly — keep an eye on the project web site!
slide 22

The library usage graphs on slides 9 and 10 clearly show that borrower behaviour has changed since the start of 2006. Given that this change coincided with the introduction of suggestions, recommendations and serendipity in the library catalogue, I believe that there’s a compelling argument that they have played a role in initiating that change.
With the continuing push for Open Data (e.g. see the recent TED talk by Tim-Berner’s Lee), I believe libraries should be seriously considering releasing their usage and attention data.
slide 23

Most usage based services require some initial data to work with. So, given that disk storage space is so cheap, it makes sense to capture as much usage/attention data as possible in advance, even if you have no immediate thoughts about how to utilise it.
Mashed Oop Multimedia
Just in case it’s of interest to anyone, we’ve started uploading videos of the opening sessions from “Mash Oop North” to Vimeo and the Internet Archive (see this blog post for links).
With the free Vimeo account, you can only upload up to 500MB a week, so it’s going to take a few weeks to get them all uploaded. However, you can find them all already on the Internet Archive.
As a taster, here’s Brendan Dawes (Creative Director at Magnetic North) strutting his funky stuff…
Mash Oop North – Brendan Dawes from Dave Pattern on Vimeo.
There’s also quite a few photos on Flickr (tagged with mashlib09)…



“Engaging our Digital Natives”, University of Bradford
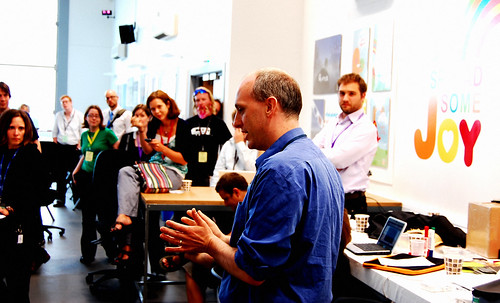
On Friday, I had the pleasure of giving a presentation (“Web 2.0 and You Too“) as part of the “Engaging our Digital Natives” event at the University of Bradford. For some reason, Slideshare isn’t showing the notes from the presentation, but they should be available if you download the Powerpoint.
Some photographs from the day are available on Flickr or as a slideshow…





Quick plug: CILIP U&CR Y&H Open Source event
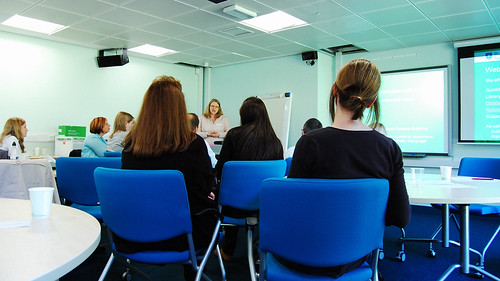
Just a quick plug to say that there are still spaces available at the “Open Source: Free Speech, Free Beer and Free Kittens!” event at Hudderfield on Friday 26th June. Full details and a link to the booking form are available on the CILIP University College and Research Group web site.
Speakers at the event include:
– Ken Chad (Ken Chad Consulting)
– Nick Dimant and Jonathan Field (PTFS Europe)
– Nicolas Morin (BibLibre)
– Richard Wallis (Talis)
…although I don’t think there’ll be any free beer or kittens on offer to delegates, there will be a free lunch which is kindly being sponsored by PTFS Europe 🙂
