Non/low library usage and final grades

Whilst chatting to one of the delegates at yesterday’s “Gaining business intelligence from user activity data” event (my Powerpoint slides can be grabbed from here) about non & low-usage of library services/resources, I began wondering how that relates to final grades.
In the previous blog post, we’ve seen that there appears to be evidence of a correlation between usage and grades, but that doesn’t really give an indication into how many students are non/low users. For example, if we happened to know that 25% of all students never borrow anything from the library, does that mean that 25% of students who gain the highest grades don’t borrow a book?
Let’s churn the data again 🙂
In the following 3 graphs, we’re looking at:

  • X axis: bands of usage (zero usage, then incremental bands of 20, then everything over 180 uses)
  • Y axis: as a percentage, what proportion of the students who achieved a particular grade are in each band

You can click on the graphs to view a full-sized version.
One of the things to look for is which grade peaks in each band of usage.
Borrowing
The usage bands represent the number of items borrowed from the library during the final 3 years of study…
horizon
caveat: we have a lot of distance learners across the world and we wouldn’t expect them to borrow anything from the library
In terms on non-usage (i.e. never borrowing an item), there’s a marked difference between those who get the two highest grades (1 and 2:1) and those who get the lowest honours grade (3). It seems that those who get a third-class honour are twice as likely to be non-users than those who get a first-class or 2:1 degree.
E-Resource Usage
The usage bands represent the number of times the student logged into MetaLib (or AthensDA) during the final 3 years of study…
metalib
caveat: this is a relatively crude measure of e-resource usage, as it doesn’t measure what the student accessed or how long they accessed each e-resource
Even at a quick glance, we can see that this graphs tells a different story to the previous one — the numbers of non-users is lower, but there’s a huge (worrying?) amount of low usage (the “1-20” band). I can only speculate on that:

  • did students try logging in but found the e-resources too difficult to use?
  • how much of an impact do the barriers to off-campus access (e.g. having to know when & how to authenticate using Athens or Shibboleth) have on repeat usage?
  • are students finding the materials they need for their studies outside of the subscription materials?

As I mentioned previously, Summon is a different kettle of fish to MetaLib, so it’s unlikely we’ll be able to capture comparative usage data — if you’ve tried using Summon, you’ll know that you don’t need to log in to use it (authentication only kicks in when you try to access the full-text). However, we’re confident that Summon’s ease-of-use and the work we’ve done to improve off-campus access will result in a dramatic increase in e-resource usage.
As before, we see it’s those students who graduate with a third-class honour who are the most likely to be non or low-users of e-resources.
Visits to the Library
The usage bands represent the number of visits to the library during the final 3 years of study…
sentry
caveat: we have a lot of distance learners across the world and we wouldn’t expect them to borrow anything the the library
Again, the graph shows that those who gain a third-class degree are twice as likely to never visit the library than those who gain a first-class or 2:1.

ILI 2009 Presentation

I really struggled to shoehorn everything I wanted to talk about during my ILI 2009 presentation into the slides, so this blog post goes into a bit more depth than I’ll probably talk about…
slide 1 & 2

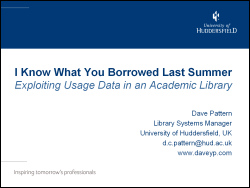
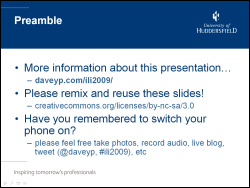
I’m still in two minds about whether or not the word “exploit” has too many negative connotations, but what the heck!
If you do use any of the content from the presentation, please drop me an email to let me know 🙂
slide 3

As part of the development of the UK version of Horizon back in the early 1990s, libraries requested that the company (Dynix) add code to log all circulation transactions. Horizon was installed at Huddersfield in 1996 and has been logging circulation data since then. At the time of writing this blog post, we’ve got data for 3,157,111 transactions.
slide 4

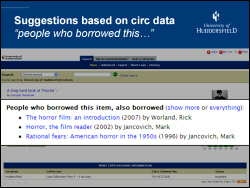
With that volume of historical data, it seemed sensible to try and create some useful services for our students. In November 2005, we started dabbling with an Amazon-style “people who borrowed this” service on our OPAC. After some initial testing and tweaking, the service went fully live in January 2006. The following month, we added a web service API (named “pewbot”).
To date, we’ve had over 90,000 clicks on the “people who borrowed this, also borrowed…” suggestions, with a peak of 5,229 clicks in a single month (~175 clicks per day). Apart from the “Did you mean?” spelling suggestions, this has been the most popular tweak we’ve made to our OPAC.
slide 5

Because we’re an academic library, we get peaks and troughs of borrowing throughout the academic year. The busiest times are the start of the new academic year in October and Easter.
slide 6

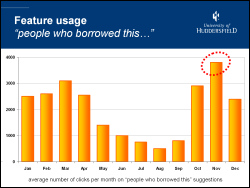
If you compare the number of clicks on the “people who borrowed this, also borrowed..” suggestions, you can see that it’s broadly similar to the borrowing graph, except for the peak usage. Due to the borrowing peak in October, in November a significant portion of our book stock will be on loan. When our students find that they books they want aren’t available, they seem to find the suggestions useful.
I’m hoping to do some analysis to see if there’s a stronger correlation between the suggested books that are clicked on and then borrowed on the same day during November than during the other months.
slide 7

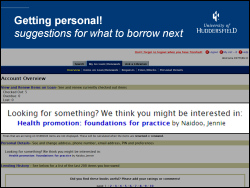
Once a user logs into the OPAC, we can provide a personal suggestion by generating the suggestions for the books they’ve borrowed recently and then picking one of the titles that comes out near the top.
slide 8

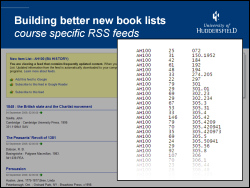
I was originally asked to come up with some code to generate new book lists for each of our seven academic schools. It turned out to be extremely hard to figure out which school a book might have been purchased for, so I turned to the historical book circulation data to come up with a better method.
Rather than having a new book list per school, we’re now offering new book lists per course of study.
The way it’s done is really simple — for each course, we analyse all of the books borrowed by students on that course and then automatically build up a Dewey lending profile. Whenever a new book is added to our catalogue, we check to see which courses have previously borrowed heavily from that Dewey class and then add the book details to their feeds.
The feeds are picked up by the University Portal, so students should see the new book list for their course and (touch wood!) the titles will be highly relevant to their studies.
slide 9

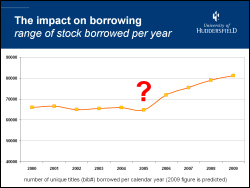
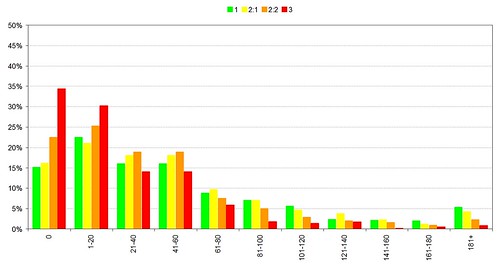
One of the comments I frequently hear is that book recommendation services might create a “vicious circle” of borrowing, with only the most popular books being recommended. At Huddersfield, we’ve seen the opposite — since adding recommendations and suggestions, the range of stock being borrowed has started to widen.
From 2000 to 2005, the range of titles being borrowed per year was around 65,000 (which is approximately 25% of the titles held by the library). Since adding the features in early 2006, we’ve seen a year-on-year increase in the range of titles being borrowed. In 2009, we expect to see over 80,000 titles in circulation, which is close to 33% of the titles held by the library.
I strongly believe that by adding serendipity to our catalogue, we’re seeing a very positive trend in borrowing by our students.
slide 10

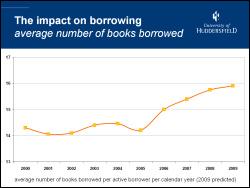
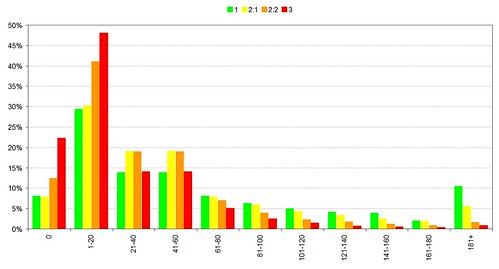
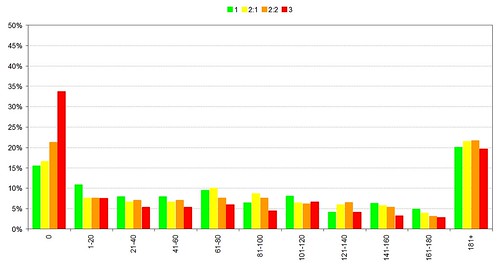
Not only are students borrowing more widely than before, they’re also borrowing more books than before. From 2000 to 2005, students would borrow an average of 14 books per year. In 2009, we’re expecting to see borrowing increase to nearly 16 books per year. We’re also seeing a year-on-year decrease in renewals — rather than keeping hold of a book and renewing it, students seem to be returning items sooner and borrowing more than ever before.
slide 11

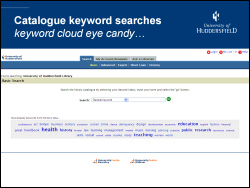
We’re also logging keyword searches on the catalogue — since 2006, we’ve logged over 5 million keyword searches and it’s fun looking at some of the trends.
As we had a bit of dead space on the OPAC front page, we decided to add some “eye candy” — in this case, it’s a keyword cloud of the most popular search terms from the last 48 hours. Looking at the usage statistics, we’re seeing that new students find the cloud a useful way of starting their very first search of the catalogue, with the usage in October nearly twice that of the next highest month.
slide 12

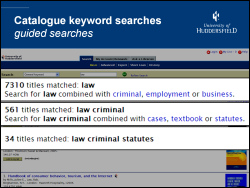
A much more useful service that we’ve built from the keywords is one that suggests good keywords to combine with your current search terms.
In the above example, we start with a general search for “law” which brings back an unmanageable 7000+ results. In the background, the code quickly searches through all of the previous keyword searches that contained law and pulls together the other keywords that are most commonly used in multi-keyword searches that included “law”. With a couple of mouse clicks, the user can quickly narrow the search down to a manageable 34 results for “criminal law statutes“.
There’re two things I really like about this service:
1) I didn’t have to ask our librarians to come up with the lists of good keywords to combine with other keywords — they’ve got much more important things to do with their time 🙂
2) The service acts as a feedback loop — the more searches that are carried out, the better the suggestions become.
slide 13

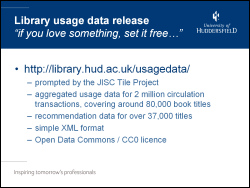
I forget exactly how this came about (but I suspect a conversation with Ken Chad sowed the initial seed), but we decided to release our circulation and recommendation data into “the wild” in December 2008 — see here for the blog post and here for the data.
The data was for every item that has an ISBN in the bibliographic record, as we felt than the ISBN would be the most useful match point for mashing the data up with other web services (e.g. Amazon).
We realised that we’d need to use a licence for the data release and, after a brief discussion with Ken Chad, it became increasingly obvious that a Public Domain licence was the most appropriate. Accordingly, the data was released under a joint Open Data Commons and (partly because we couldn’t decide which licence was the best one!). In other words, we wanted it to be really clear that there were “no strings” attached to how the data could be used.
slide 14

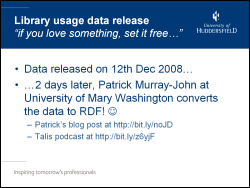
Within a couple of days of releasing the data, Patrick Murray-John at the University of Mary Washington had taken it and “semantified” the data.
A few weeks later, I had the privilege of chatting to Patrick and Richard Wallis when we took part in a Talis Podcast about the data release.
slide 15

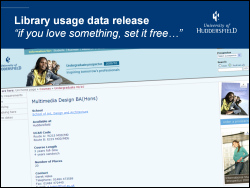
My great friend Iman Moradi (formerly a lecturer at Huddersfield and now the Creative Director of Running in the Halls) used some of the library data as part of the Multimedia Design course.
slides 16 & 17

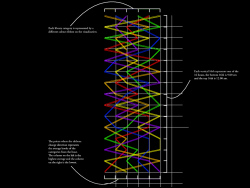
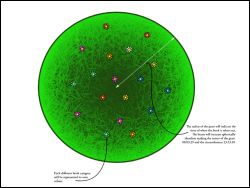
Iman’s students used the library data to generate some really cool data visualisations — it was really hard to narrow them down to just two images for the ILI presentation. The second image made me think of Ranganathan‘s 5th Law of Library Science: “The library is a growing organism” 🙂
slide 18

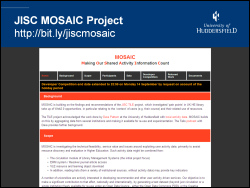
The JISC funded MOSAIC Project (Making Our Shared Activity Information Count), which followed on from the completed TILE Project, is exploring the benefits that can be derived from library usage and attention data.
Amongst the goals of the project are to:

  • Encourage academic libraries to release aggregated/anonymised usage data under an open licence
  • Develop a prototype search engine capable of providing course/subject specific relevancy ranked results

The prototype search engine is of particular interest, as it uses the pooled usage/attention data to rank results so that the ones which are more relevant to the student (based on their course) are boosted. For example, if a law student did a search for “ethics”, books on legal ethics would be ranked higher than those relating to nursing ethics, ethics in journalism, etc. This is achieved by deep analysis of the behaviour of other law students at a variety of universities.
slide 19

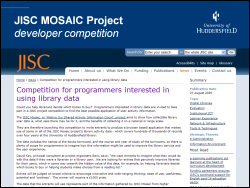
The MOSAIC Project is also encouraging the developer community to engage with the usage data, and this included sponsorship of a developer competition.
they
slides 20 & 21

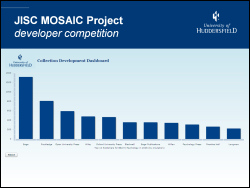
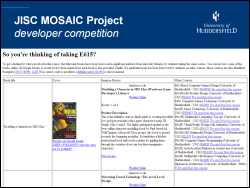
It was hard to pick which competition entries to include in the presentation, so I just picked a couple of them at random. The winning entry, and the two runners up, should be announced shortly — keep an eye on the project web site!
slide 22

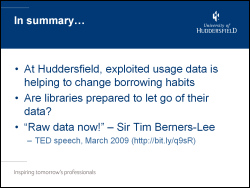
The library usage graphs on slides 9 and 10 clearly show that borrower behaviour has changed since the start of 2006. Given that this change coincided with the introduction of suggestions, recommendations and serendipity in the library catalogue, I believe that there’s a compelling argument that they have played a role in initiating that change.
With the continuing push for Open Data (e.g. see the recent TED talk by Tim-Berner’s Lee), I believe libraries should be seriously considering releasing their usage and attention data.
slide 23

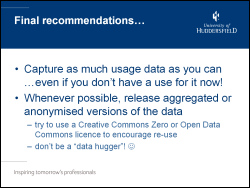
Most usage based services require some initial data to work with. So, given that disk storage space is so cheap, it makes sense to capture as much usage/attention data as possible in advance, even if you have no immediate thoughts about how to utilise it.

Simple API for JISC MOSAIC Project Developer Competition data

For those of you interested in the developer competition being run by the JISC MOSAIC Project, I’ve put together a quick & dirty API for the available data sets. If it’s easier for you, you can use this API to develop your competition entry rather than working with the entire downloaded data set.

edit (31/Jul/2009): Just to clarify — the developer competition is open to anyone, not just UK residents (however, UK law applies to how the competition is being run). Fingers crossed, the Project Team is hopeful that a few more UK academic libraries will be adding their data sets to the pot in early August.

The URL to use for the API is https://library.hud.ac.uk/mosaic/api.pl and you’ll need to supply a ucas and/or isbn parameter to get a response back (in XML), e.g.:

The “ucas” value is a UCAS Course Code. You can find these codes by going to the UCAS web site and doing a “search by subject”. Not all codes will generate output using the API, but you can find a list of codes that do appear in the MOSAIC data sets here.
If you use both a “ucas” and “isbn” value, the output will be limited to just transactions for that ISBN on courses with that UCAS course code.
You can also use these extra parameters in the URL…

  • show=summary — only show the summary section in the XML output
  • show=data — only show the data in the XML output (i.e. hide the summary)
  • prog=… — only show data for the specified progression level (e.g. staff, UG1, etc, see documentation for full list)
  • year=… — only show data for the specified academic year (e.g. 2005 = academic year 2005/6)
  • rows=… — max number of rows of data to include (default is 500) n.b. the summary section shows the breakdown for all rows, not just the ones included by the rows limit

The format of the XML is pretty much the same as shown in the project documentation guide, except that I’ve added a summary section to the output.
Notes
The API was knocked together quite quickly, so please report any bugs! Also, I can’t guarentee that the API is 100% stable, so please let me know (e.g. via Twitter) if it appears to be down.

Peaks and troughs in borrowing

A good couple of years ago, I blogged about “lending paths”, but we’ve not really progressed things any further since then. I still like the idea that you can somehow predict books that people might/should borrow and also when you might get a sudden rush of demand on a particular title.
Anyway, whilst heading back up north after the “Library Domain Model” workshop, I got wondering about whether we could use historical circulation data to manage the book stock more effectively.
Here’s a couple of graphs — the first is for “Strategic management: awareness and change” (Thompson, 1997) and the second is for “Strategic management: an analytical introduction” (Luffman, 1996)…


The orange bars are total number of times the book has been borrowed in that particular month. The grey bars show how many times we’d have expected the book to be loaned in that month if the borrowing for that book had followed the global borrowing trends for all stock.
Just to explain that it a little more depth — by looking at the loans for all of our stock, we can build up a monthly profile that shows the peaks and troughs throughout the academic year. If I know that a particular book has been loaned 200 times, I can have a stab at predicting what the monthly breakdown of those 200 loans would be. So, if I know that October accounts for 20% of all book loans and July accounts for only 5%, then I could predict that 40 of those 200 loans would be from October (200 x 20%) and that 10 would be from July (200 x 5%). Those predictions are the grey bars.
For both of the books, the first thing that jumps out is the disconnect between the actual (orange) number of loans in May and the prediction (grey). In other words, both books are unusually popular (when compared to all the other books in the library) in that month. So, maybe in March or April, we should think about taking some of the 2 week loan copies and changing them to 1 week loans (and then change them back in June), especially if students have had to place hold requests in previous years.


For some reason, I didn’t take any photos at the “Library Domain Model” event itself, but I did do the “tourist thing” on the South Bank…
london_021 london_019 london_037 london_024

Presentation to the TILE Project meeting in London

About 90 minutes ago, I had the pleasure of doing a short presentation to the JISC TILE Project’s “Sitting on a gold mine” workshop in London. Unfortunately I wasn’t able to present in person, so we had a go doing it all via a video conferencing link. As far as I can tell, it seemed to go okay!
The presentation was an opportunity to formally announce the release of the usage data.
Our Repository Manager was keen to try putting something non-standard into the repository and twisted my arm into recording the audio… and I’d forgotten how much I hate hearing my own voice!!!
Anyway, as soon as SlideShare starts playing ball, I’ll have a go uploading and sync’ing the audio track. Otherwise, here’s a copy of the PowerPoint: “Can You Dig It?: A Systems Perspective” and you can hear the audio by clicking on the Flash player below…
[audio:https://library.hud.ac.uk/ppt/CanYouDigIt.mp3]
The workshop had a copy of the PowerPoint that they were running locally, so every now and then you’ll hear me say “next slide”.
I haven’t listened to much of the audio, so I’ve got my fingers crossed I didn’t say anything too stupid!!!
[edit]
Well, here’s my first attempt at SlideCasting…

Can You Dig It
View SlideShare presentation or Upload your own.

…I had no idea how much I go “erm” when presenting! :-S

Free book usage data from the University of Huddersfield

I’m very proud to announce that Library Services at the University of Huddersfield has just done something that would have perhaps been unthinkable a few years ago: we’ve just released a major portion of our book circulation and recommendation data under an Open Data Commons/CC0 licence. In total, there’s data for over 80,000 titles derived from a pool of just under 3 million circulation transactions spanning a 13 year period.
https://library.hud.ac.uk/usagedata/
I would like to lay down a challenge to every other library in the world to consider doing the same.
This isn’t about breaching borrower/patron privacy — the data we’ve released is thoroughly aggregated and anonymised. This is about sharing potentially useful data to a much wider community and attaching as few strings as possible.
I’m guessing some of you are thinking: “what use is the data to me?”. Well, possibly of very little use — it’s just a droplet in the ocean of library transactions and it’s only data from one medium-sized new University, somewhere in the north of England. However, if just a small number of other libraries were to release their data as well, we’d be able to begin seeing the wider trends in borrowing.
The data we’ve released essentially comes in two big chunks:
1) Circulation Data

This breaks down the loans by year, by academic school, and by individual academic courses. This data will primarily be of interest to other academic libraries. UK academic libraries may be able to directly compare borrowing by matching up their courses against ours (using the UCAS course codes).

2) Recommendation Data

This is the data which drives the “people who borrowed this, also borrowed…” suggestions in our OPAC. This data had previously been exposed as a web service with a non-commercial licence, but is now freely available for you to download. We’ve also included data about the number of times the suggested title was borrowed before, at the same time, or afterwards.

Smaller data files provide further details about our courses, the relevant UCAS course codes, and expended ISBN lookup indexes (many thanks to Tim Spalding for allowing the use of thingISBN data to enable this!).
All of the data is in XML format and, in the coming weeks, I’m intending to create a number of web services and APIs which can be used to fetch subsets of the data.
The clock has been ticking to get all of this done in time for the “Sitting on a gold mine: improving provision and services for learners by aggregating and using learner behaviour data” event, organised by the JISC TILE Project. Therefore, the XML format is fairly simplistic. If you have any comments about the structuring of the data, please let me know.
I mentioned that the data is a subset of our entire circulation data — the criteria for inclusion was that the relevant MARC record must contain an ISBN and borrowing must have been significant. So, you won’t find any titles without ISBNs in the data, nor any books which have only been borrowed a couple of times.
So, this data is just a droplet — a single pixel in a much larger picture.
Now it’s up to you to think about whether or not you can augment this with data from your own library. If you can’t, I want to know what the barriers to sharing are. Then I want to know how we can break down those barriers.
I want you to imagine a world where a first year undergraduate psychology student can run a search on your OPAC and have the results ranked by the most popular titles as borrowed by their peers on similar courses around the globe.
I want you to imagine a book recommendation service that makes Amazon’s look amateurish.
I want you to imagine a collection development tool that can tap into the latest borrowing trends at a regional, national and international level.
Sounds good? Let’s start talking about how we can achieve it.


FAQ (OK, I’m trying to anticipate some of your questions!)
Q. Why are you doing this?
A. We’ve been actively mining circulation data for the benefit of our students since 2005. The “people who borrowed this, also borrowed…” feature in our OPAC has been one of the most successful and popular additions (second only to adding a spellchecker). The JISC TILE Project has been debating the benefits of larger scale aggregations of usage data and we believe that would greatly increase the end benefit to our users. We hope that the release of the data will stimulate a wider debate about the advantages and disadvantages of aggregating usage data.
Q. Why Open Data Commons / CC0?
A. We believe this is currently the most suitable licence to release the data under. Restrictions limit (re)use and we’re keen to see this data used in imaginative ways. In an ideal world, there would be services to harvest the data, crunch it, and then expose it back to the community, but we’re not there yet.
Q. What about borrower privacy?
A. There’s a balance to be struck between safeguarding privacy and allowing usage data to improve our services. It is possible to have both. Data mining is typically about looking for trends — it’s about identifying sizeable groups of users who exhibit similar behaviour, rather than looking for unique combinations of borrowing that might relate to just one individual. Setting a suitable threshold on the minimum group size ensures anonymity.

Coming soon, to a blog near here…

Okay — I’m the first to admit I don’t blog enough… I still haven’t even blogged about how great Mashed Library 2008 was (luckily other attendees have already blogged about it!)
Anyway, unless I get run over by a bus, later on this week I’m going to post something fairly big — well, it’s about 90MB which perhaps isn’t that “big” these days — that I’m hoping will get a lot of people in the library world talking. What I’ll be posting will just be a little droplet, but I’m hoping one day it’ll be part of a small stream …or perhaps even a little river.

(view slideshow of Mashed Library 2008)

Stuck on a train

The joys of free wifi slightly make up for the fact that I’m stuck on a train that’s going nowhere fast — the East Coast main line is suffering long delays due to the train which was ahead of mine managing to damage and bring down the overhead power lines :-S
Today was the first meeting for the JISC Towards Implementation of Library 2.0 and the e-Framework (TILE), held at the impressive LSE Library in London.
I’m still not 100% sure what the TILE Project will manage to achieve, but it was great to spend 4 hours in a room full of people who are keen to liberate and share library data, primarily for the benefit of our users.
tile_001 tile_006 tile_002
tile_003 tile_005 tile_004