After killing off Hot Stuff due to a server upgrade, I find that I’m kinda missing it!
So, I’ve decided to have a second stab at the problem and this time the code is much cleaner and faster. In particular, I’m using Bloglines to handle fetching all of the feeds and then grabbing the new posts via the Bloglines API.
It’s too early for the code to start spotting new keywords and topics yet, so it’ll be early in the new year before it launches fully. In the meantime, feel free to check that your favourite library/librarian blogs are included in the list of sites I’m pulling content from: http://www.bloglines.com/public/liblogs.
Please post a comment with the URL of any blogs you’d like including!
I’m hoping the make the new code a little more visual, so expect to see things like these…
[edit] HotStuff 2.0 is gradually appearing here: http://www.daveyp.com/hotstuff/
Category: Eye Candy
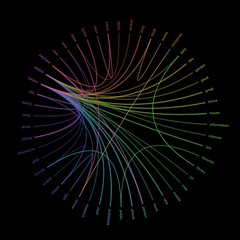
Dewey friend wheel
I’ve been meaning to have a stab at creating something similar to a friend wheel, but using library data, for a while now. Here’s a prototype which uses our “people who borrowed this, also borrowed…” data to try find strong borrowing relationships…
I picked three random Dewey numbers and hacked together a quick PerlMagick script to draw the wheel:
- 169 – Logic -> Analogy (orange)
- 822 – English & Old English literatures -> Drama (purple)
- 941 – General history of Europe -> British Isles (light blue)
The thickness and brightness of the line indicates the strength of the relationship between the two classifications. For example, for people who borrowed items from 941, we also see heavy borrowing in the 260’s (Christian social theology), 270’s (Christian church history), and the 320’s (Political science).
The next step will be to churn through all of the thousand Dewey numbers and draw a relationship wheel for our entire book stock. I’ve left my work PC on to crunch through the raw data overnight, so hopefully I’ll be able to post the image tomorrow.
Psycho collage
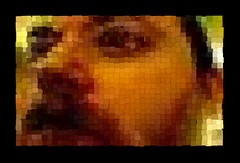
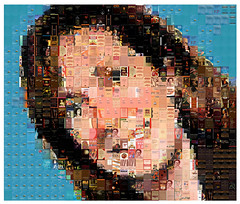
Following on from the book covers arranged by hue/lightness, I’ve been playing around with the 1000 Frames of Hitchcock thumbnails.
Here’s the result of 15 minutes of coding and 2 hours of rendering using a single frame from the famous shower scene in Psycho…

To see the individual frames, you really need to view the full sized image (9526 x 5475 pixels).
The code works by sampling a pixel and then randomly selecting a frame that has a similar hue and lightness value. As before, a little bit of randomess (position, rotation and size) is thrown in to make it visually more interesting.
Our books, arranged by Hue and Lightness
Sunday afternoons were made for doing this kind of thing…
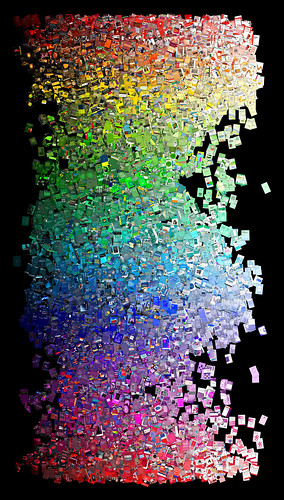
(click here for the biggest version)
Several thousand of our books, arranged vertically by hue and horizontally by lightness. The value was calculated by finding the average colour of the book cover and then converting that to the relevant HSL value. There’s a little bit of randomness thrown in too, in terms of rotation and position. The image was created using Perl and ImageMagick.
If nothing else, it shows that we have more red and blue books than green or pink ones!
Edible Pie Chart
This opens up all sorts of possibilities for tasty representations of data 🙂

(found at information aesthetics)
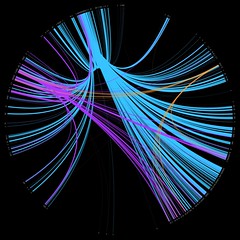
Playing with Processing
Iman first mentioned Processing ages ago, but it’s only recently I’ve gotten around to having a play with it.
So, this is my first stab at coming up with something visual and it’s in the same vein as Dewey Blobs…
…you’ll need Java installed to view it.
Rather than lay Dewey out on a 2D gird, I’m using a 10x10x10 cube (000 is at the front-top-left and 999 is at the back-bottom-right of the cube). The code then cycles through all of the check-outs (orange) and check-ins (blue) from a single day, with a zigzagging 3D line linking up the previous transactions.
What I originally wanted to achieve was to have two curving lines, snaking their way through the cube, but figuring out how to do the Bezier curves made my brain hurt 😉 Anyway, if you want to see a version where the line runs more quickly, click here — it’s harder to read the book titles, but the lines fade away more realistically. Or, here’s a 3rd version that doesn’t include the Dewey classification or book title.
A word of warning: the Java might chomp away at your CPU, so I’m not sure how well it’ll run on a slower PC.
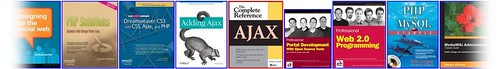
Reshelve all your books by the colour of their spine
Thanks to Iman for jogging my memory about this blog post which I’d been meaning to blog about for the last couple of weeks — in fact, I was chatting to someone after the ARCLib Conference in Liverpool last week about it, but couldn’t remember the name of the library for the life in me (it’s the Emily Carr University Library)…

The above was a senior grad project by Valérie Madill and you can find further details here: “Looking at Libraries: Defining Space Through Content“.
During my ARCLib presentation (which bizarrely ended up as a featured slideshow on the slideshare home page!?!), I mentioned the book shop in San Francisco that Chris Cobb famously rearranged by colour (see Flickr)…

I must briefly mention that the last session of the conference was given by Stephanie Davies of laughology.co.uk. I don’t think I’ve ever laughed so much at a library conference 😀
Just in case anyone didn’t believe me that there’s a web page with a list of dirty library words, it’s here!
I’m itching to do something cool on one of our library’s plasma screens and I was wondering about hooking it up to a webcam and doing something like this, but using book cover thumbnails instead of the square blocks of colour?
I think I’ve still got the code I used to creating the “librarians as books” kicking around somewhere…
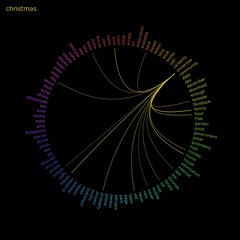
Dewey Blobs
I’ve been fascinated by data visualisation for a year or two now, and I’ve recently been chatting to my good friend Iman about doing something with our circulation data. In particular, something that will be visually interesting to look at, whilst also giving you a feel for the data.
I’ve tried a few different things, but the Dewey Blobs are currently my favourite…
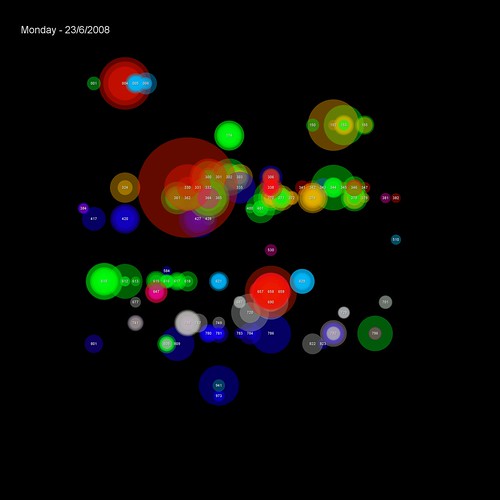
(items borrowed on 23rd June)
The transactions are placed on a 32×32 grid based on their Dewey classification (000-999). Each transaction is shown as a semi-transparent circle with two attributes:
1) colour — based on the School the student making the transaction studies in
2) size — based on the popularity of the book (the larger the circle, the more times it’s been borrowed before)
Where many students from the same school borrow from the same Dewey classification on the same day, the colour is reinforced. If the borrowing is from multiple schools, then the colours begin to blend to create new hues.
For example, on this day the vast majority of transactions in the 300s were by Human & Health students (green)…

…but a couple of days later, the borrowing in the 300s is more complex, with students from several schools appearing (Business students are red and Music & Humanities students are blue)…

You can browse through a few of the blobs on Flickr.
Visual virtual shelf browsing
The Zoomii web site seems to be getting a lot of attention at the moment, so I got wondering how easy/difficult it would be do to a virtual bookshelf in the OPAC…
It’s definitely a “crappy prototype” at the moment, and the trickiest thing turned out to be getting the iframe to jump to the middle (where, hopefully, the book you’re currently browsing is shown). Anyway, you can see it in action on our OPAC.
I suspect the whole thing would work much better in Flash and it would look really cool if it used a Mac “dock” style effect. I wonder if I can persuade Iman to conjure up some Flash? 😉
Google Graphs
We’ve had loan data on the OPAC for a couple of years now, although it’s only previously been visible to staff IP addresses. Anyway, a couple of months ago, I revamped it using Google Graphs and I’ve finally gotten around to adding a stats link that anyone can peruse — you should be able to find it in the “useful links” section at the foot of the full bib page on our OPAC.
As an example, here are the stats for the 2006 edition of Giddens’ “Sociology“…