Peaks and troughs in borrowing

A good couple of years ago, I blogged about “lending paths”, but we’ve not really progressed things any further since then. I still like the idea that you can somehow predict books that people might/should borrow and also when you might get a sudden rush of demand on a particular title.
Anyway, whilst heading back up north after the “Library Domain Model” workshop, I got wondering about whether we could use historical circulation data to manage the book stock more effectively.
Here’s a couple of graphs — the first is for “Strategic management: awareness and change” (Thompson, 1997) and the second is for “Strategic management: an analytical introduction” (Luffman, 1996)…


The orange bars are total number of times the book has been borrowed in that particular month. The grey bars show how many times we’d have expected the book to be loaned in that month if the borrowing for that book had followed the global borrowing trends for all stock.
Just to explain that it a little more depth — by looking at the loans for all of our stock, we can build up a monthly profile that shows the peaks and troughs throughout the academic year. If I know that a particular book has been loaned 200 times, I can have a stab at predicting what the monthly breakdown of those 200 loans would be. So, if I know that October accounts for 20% of all book loans and July accounts for only 5%, then I could predict that 40 of those 200 loans would be from October (200 x 20%) and that 10 would be from July (200 x 5%). Those predictions are the grey bars.
For both of the books, the first thing that jumps out is the disconnect between the actual (orange) number of loans in May and the prediction (grey). In other words, both books are unusually popular (when compared to all the other books in the library) in that month. So, maybe in March or April, we should think about taking some of the 2 week loan copies and changing them to 1 week loans (and then change them back in June), especially if students have had to place hold requests in previous years.


For some reason, I didn’t take any photos at the “Library Domain Model” event itself, but I did do the “tourist thing” on the South Bank…
london_021 london_019 london_037 london_024

Quick plug: CILIP U&CR Y&H Open Source event

Just a quick plug to say that there are still spaces available at the “Open Source: Free Speech, Free Beer and Free Kittens!” event at Hudderfield on Friday 26th June. Full details and a link to the booking form are available on the CILIP University College and Research Group web site.
Speakers at the event include:
– Ken Chad (Ken Chad Consulting)
– Nick Dimant and Jonathan Field (PTFS Europe)
– Nicolas Morin (BibLibre)
– Richard Wallis (Talis)
…although I don’t think there’ll be any free beer or kittens on offer to delegates, there will be a free lunch which is kindly being sponsored by PTFS Europe 🙂

Web service for the free book usage data

I’ve been meaning to get around to adding a web service front end on to the book usage data that we released in December for ages. So, better late than never, here it is!
It’s not the fastest bit of code I’ve ever written, but (if there’s enough interest) I could speed it up.
The web service can be called a couple of different ways:
1) using an ISBN
Examples:
a) https://library.hud.ac.uk/api/usagedata/isbn=0415014190 (“Language in the news”)
b) https://library.hud.ac.uk/api/usagedata/isbn=159308000X (“The Adventures of Huckleberry Finn”)
Assuming a match is located, data for 1 or more items will be returned. This will include FRBR style matching using the LibraryThing thingISBN data, as shown in the second example where we don’t have an item which exactly matches the given ISBN.
2) using an ID number
Examples:
a) https://library.hud.ac.uk/api/usagedata/id=125120 (“Language and power”)
The item ID numbers are included in the suggestion data and are the internal bibliographic ID numbers used by our library management system.
——————-
edit 1: I should also have mentioned that the XML returned is essentially the same format as described here.
edit 2: Ive now re-written the code as a mod_perl script (to make it faster when using ISBNs) and slightly altered the URL

Keyword search data

We’ve been logging all keyword searches on our OPAC for nearly 3 years and now have details for over 3 million searches. Just in case the data is of any use to anyone, I’ve uploaded an aggregated XML version to our web server: https://library.hud.ac.uk/data/keyworddata/
As with the usage data, we’re putting it out there with no strings attached by using an Open Data Commons Licence.
The XML file contains a list of about 8,500 keywords. For each keyword, there’s a list of other terms that have been used with that keyword in multi-term searches. The readme file contains more information about the structure.

Mashed Library UK 2009 – Mash Oop North!

The date for your diary is Tuesday 7th July 2009 and the event will take place in a large studio space in the Creative Arts Building at the University of Huddersfield. The online registration form should appear before the end of April.
If you want to keep up-to-date with the event, then make sure you join the mashedlibrary group on ning.com. You can also subscribe to the RSS feed from the event blog and the Twitter hash is #mashlib09.
The planning for the event is very much a group effort with seven of us having semi-regular meetings in pubs: Zoë, Lisa, Bryony, Tanya, Iman, Graham and myself. Although there’s still plenty of logistical stuff to figure out, it feels like the event is coming together nicely and hopefully we’ve managed to incorporate most of the feedback and suggestions from the first event.
The event will mostly be an unconference and we’re aiming to create an environment that will encourage networking, creativity and fun. Ideally, we’d like to attract a good mix of developers and tech-savvy librarians, and we think we can probably fit around 50 people into the studio.
The plan is to kick off with a couple of structured sessions, which will include an introduction to using Yahoo Pipes for those of you who’ve never played with mashups before (courtesy of the one-and-only Tony Hirst). At the same time, there’ll be a more techie session for the developers.
After those sessions, we’ll move to a more informal unconference style event. You’ll be encouraged to network, to get creative with the various available data sources, to brainstorm new ideas and to come up with prototypes.
If you’re a librarian with ideas, then Mashed Library is a fantastic opportunity to meet with techies who can turn those ideas into working prototypes and services. And, if you’re a techie, this is a chance to brainstorm with librarians and write code that’ll provide cool new services to library users!
We’d also like to encourage student librarians (and any other students who love libraries) to come to the event. We’ll shortly be announcing how you can apply for sponsorship to attend for free and to have your travel costs covered.
Speaking of sponsorship, we’d like to thank Talis for stepping up to be the main sponsors of the event. Talis have a long history of helping sponsor developer events (e.g. Code4Lib 2009) and they’ll be ensuring you don’t faint from lack of nourishment during the day!
We also like to attract sponsorship for prizes. If you’re an organisation who can make data available for the event, we’d love you to sponsor a prize for the best use of your data on the day (please get in touch with me if you’d like to discuss this)
Throughout the day we’ll be running short 5 minute “lightning talks”. Who’ll be giving those talks? You will, of course! The talks will be your chance to pitch an idea, show off something you’ve done, talk about your favourite web site/service, or to just rant for a few minutes. The talks will be optional, but we’re sure they’ll be something of interest to everyone.

Books that connect users

I thought it would be interesting to trawl the data and find out which books have been borrowed by the largest number of different courses within the university. I forget what the correct Graph Theory term is, but these are the books (nodes?) that connect together (edges?) the largest number of separate groups of students (networks?). The figure in brackets is the number of different courses that have borrowed the book.

  1. Questionnaire design, interviewing and attitude measurement by Oppenheim (245)
  2. Doing your research project: a guide for first-time researchers in education and social science (3rd ed) by Bell (215)
  3. Real world research: a resource for social scientists and practitioner-researchers (2nd ed) by Robson (190)
  4. Organisational behaviour and analysis: an integrated approach by Rollinson, Broadfield & Edwards (167)
  5. Sociology (3rd ed) by Giddens (161)
  6. The reflective practitioner: how professionals think in action by Schön (152)
  7. Experiential learning: experience as the source of learning and development by Kolb (150)
  8. Strategic management: awareness and change (3rd ed) by Thompson (134)
  9. Strategic management: an analytical introduction (3rd ed) by Luffman (133)
  10. Sociology: themes and perspectives (5th ed) by Haralambos & Holborn (133)
  11. Educating the reflective practitioner: toward a new design for teaching and learning in the professions by Schön (131)
  12. The good research guide: for small-scale social research projects by Denscombe (129)
  13. Qualitative data analysis: an expanded sourcebook (2nd ed) by Miles & Huberman (127)
  14. Health promotion: foundations for practice (2nd ed) by Naidoo & Wills (125)
  15. Team roles at work by Belbin (124)
  16. Research methods in education (5th ed) by Cohen, Manion & Morrison (124)
  17. How to research by Blaxter, Hughes & Tight (124)
  18. Understanding organizations (4th ed) by Handy (123)
  19. Basics of qualitative research: techniques and procedures for developing grounded theory (2nd ed) by Strauss & Corbin (121)
  20. The study skills handbook by Cottrell (120)
  21. Health promotion: models and values (2nd ed) by Downie, Tannahill & Tannahill (120)
  22. Doing qualitative research: a practical handbook by Silverman (116)
  23. Marketing by Lancaster & Reynolds (116)
  24. Reflection: turning experience into learning by Boud, Keogh & Walker (113)
  25. Management (6th ed) by Stoner, Freeman & Gilbert (109)
  26. No sweat!: the indispensable guide to reports and dissertations by Irving & Smith (109)
  27. The good study guide by Northedge (106)
  28. Research methods for nurses and the caring professions (6th ed) by Abbott & Sapsford (106)
  29. Marketing by Lancaster & Reynolds (106)
  30. Operations and the management of change by Gilgeous (106)

Conversely, these are the books that have only ever been borrowed by students on one specific course. The figure in brackets is the number of loans.

  1. The meaning of everyday occupation by Hasselkus (61)
  2. Perspectives in human occupation: participation in life by Kramer, Hinojosa & Royeen (48)
  3. Introduction to podopediatrics (2nd ed) by Thomson & Volpe (42)
  4. Occupational therapy without borders: learning from the spirit of survivors by Algado, Pollard & Kronenberg (38)
  5. Transformation through occupation by Watson & Swartz (38)
  6. Operating department practice A-Z by Smith & Williams (31)
  7. Lully, lulla, thou little tiny child: for soprano solo and SATB (unaccompanied), op.25 no.2 by Leighton (31)
  8. Five childhood lyrics: for unaccompanied mixed voices by Rutter (31)
  9. Task analysis: an occupational performance approach by Watson & Llorens (30)
  10. Conditions in occupational therapy: effect on occupational performance (3rd ed) by Atchison & Dirette (30)

The impact of serendipity (part 2)

I promised I’d dig a bit deeper into the book data, so here goes!
We have seven academic schools in the university, so I thought it would be interesting to see how the range of titles broke down by each school. As previously noted, the borrowing patterns seem to have changed at the end of 2005/start of 2006, so here’s the percentage change for the two periods…

academic school       average range of titles borrowed    % change
                            2000-2005        2006-2008
Music, Humanities & Media      16,760           20,468      122.1%
Business                        9,431           11,402      120.9%
Computing & Engineering         7,033            6,771       96.3%
Education                      12,485           11,909       95.4%
Human & Health Sciences        16,427           20,274      123.4%
Applied Sciences                7,356            7,562      102.8%
Art, Design & Architecture      9,361           12,309      131.4%

So, first of all, the increase in range of titles being borrowed isn’t across the board. I knew Computing & Engineering borrowing had been in decline for a number of years, but I’m surprised to see that the same applies for Education. Applied Sciences has stayed pretty much the same, but the other 4 schools have seen sizeable increases in the range of titles being borrowed.
The Art & Design section of the library was revamped in 2005, so it could be that we’ve seen an increase in the number of students using the library and that has driven the increased borrowing since then for that school.
A few of the comments suggested that loans per borrower would be a useful metric. Unfortunately I don’t have the data for the total number of students in each school per year, so I’m using the total number of active borrowers instead…

academic school      average loans per active borrower    % change
                            2000-2005        2006-2008
Music, Humanities & Media        26.1             25.7       98.6%
Business                         10.2             12.3      121.4%
Computing & Engineering           8.3              7.7       93.6%
Education                        15.1             14.0       92.8%
Human & Health Sciences          15.3             18.8      122.6%
Applied Sciences                 11.8             13.3      112.1%
Art, Design & Architecture       10.6             10.4       98.4%

Again a decline in Computing and Education. Art & Design and Music & Humanities have remained pretty much the same. The other 3 schools have seen an increase in the number of loans per active borrower.
One final set of data — the number of active borrowers per school…

academic school    average active borrowers per school    % change
                                2000-2005    2006-2008
Music, Humanities & Media           1,537        1,976      128.5%
Business                            2,557        2,963      115.8%
Computing & Engineering             1,650        1,527       92.5%
Education                           1,526        1,988      130.3%
Human & Health Sciences             3,587        4,581      127.7%
Applied Sciences                    1,267        1,243       98.1%
Art, Design & Architecture          1,621        2,332      143.9%

It looks like there are a couple of things going on here…
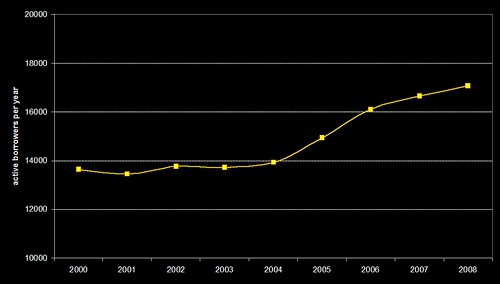
1) In the last 3 years, the number of active borrowers (i.e. users who have borrowed at least one item) has increased. In the period 2000-2004, the total number of active student borrowers was relatively static (around 14,000) and since 2005 it’s been on the increase (with just over 17,000 in 2008).
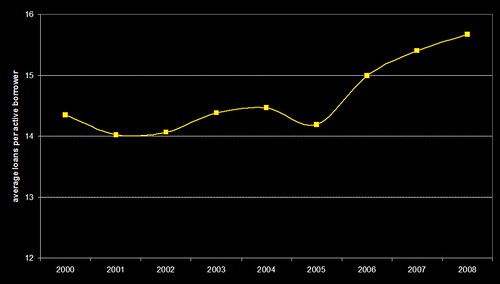
2) Overall, there’s an increase in the average number of books borrowed per active borrower, primarily driven by the two schools with the highest number of active borrowers (Business and Human & Health). The increases in those two schools more than offsets the decreases seen in a couple of the other schools (Computing and Education).
At a time when some other UK academic libraries have reported a decrease in borrowing, both of the above are good news for our library. I’ll need to go back to the SCONUL stats to check, but I don’t think we’ve seen much of an increase in book stock in the last decade (I suspect it might actually have decreased).
So, can we actually say anything about the impact of serendipity? If we look in more depth at the average number of books borrowed per active borrower per year for all students, we get this…
loansperactiveborrower
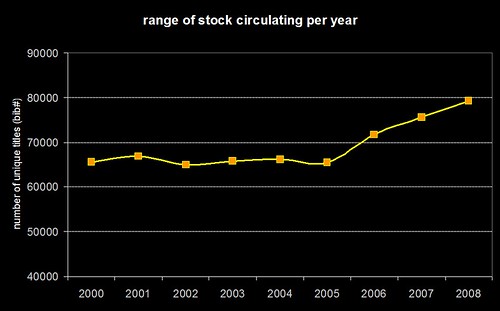
…which closely resembles the original graph from the first post showing the range of unique titles borrowed per year…
interesting
…and the number of active borrowers per year also shows a similar trend…
activeborrowers
It’s obvious that there’s a driver in there somewhere which has caused the average number of loans per active borrower to increase since 2005. Hand-in-hand there’s been a similar increases in the range of stock that’s being borrowed and the number of active borrowers.
As more people use the library, one would perhaps expect the range of stock being borrowed to increase. However, would you also expect the average number of loans per borrower to increase (bearing in mind that the stock levels have probably not increased and may have actually decreased during that period)?
I’m still not entirely sure I’ve shown that adding serendipity to an OPAC increases the range of stock being borrowed (that’s probably more influenced by the number of active borrowers), but there may well be a link with the average number of books loaned to each borrower.
Now, to change the topic, here’s one final graph that I included in the UKSG presentation — it shows the number of clicks per month on the books in the OPAC’s virtual shelf browser
virtualshelfbrowser
…seeing as this was just an experimental feature that added a bit of “book cover eye candy” to the OPAC, I’m amazed how heavily it’s being used. Whilst fixing one of our dedicated catalogue PCs in the library on Friday, I noticed that a student was carrying out a search, then picking a relevant search result, then using the shelf browser to look at all of the nearby books. And to think I’m usually dismissive of the benefits of browsing within OPACs 😀