Here’s the next batch of results — this time lots of pretty graphs 😉
The shorthand descriptions for the features are as follows:
stealth OPAC — embedding the OPAC in other applications and getting the OPAC to where the user is
did you mean — spelling suggestions for search keywords
enriched — third party book cover scans, table of contents, trusted reviews, etc
RSS feeds — new book lists, RSS feeds of searches, search alerts, etc
facets — faceted browsing of results
also borrowed — “people who borrowed this also borrowed…” suggestions based on circulation data
user tagging — allowing the user to apply their own keywords (tags) to items in the OPAC
user comments — allowing the user to add their own reviews and comments to items in the OPAC
user learning — an “intelligent” OPAC that makes personalised suggestions based on what the user does
user ratings — allowing the user to add their own ratings or scores to items in the OPAC
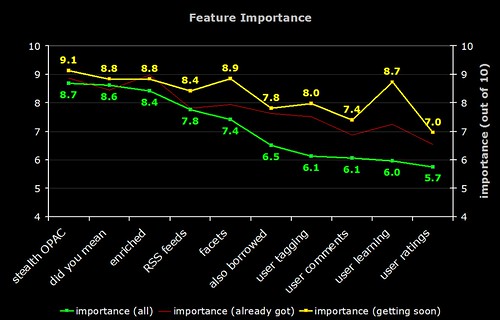
1) Importance of Features and the Number of Implementations
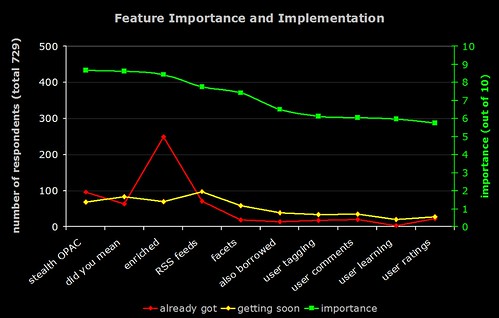
The green line (right hand axis) is the average perceived importance of the 10 OPAC features. The red line is number of respondents who have already implemented the feature, and the yellow line is the number who are planning to implement it soon.
2) Importance of Features and Predicted Number of Implementations
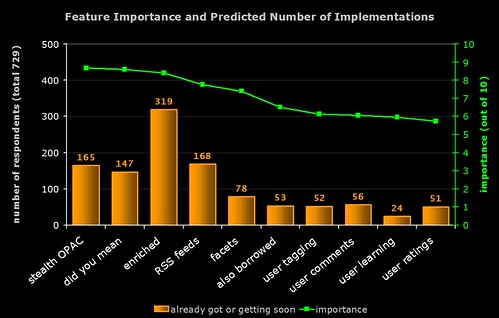
The green line (right hand axis) is the average perceived importance of the 10 OPAC features. The orange bar is number of respondents who have already implemented the feature or who are planning to implement it soon (i.e. the result of combining the red and yellow lines from the previous graph).
Note the high number of implementations of “enriched content”. In general, features with lower perceived importance are less likely to have been (or are about to be) implemented.
3) Rate of Increase of Feature Implementation
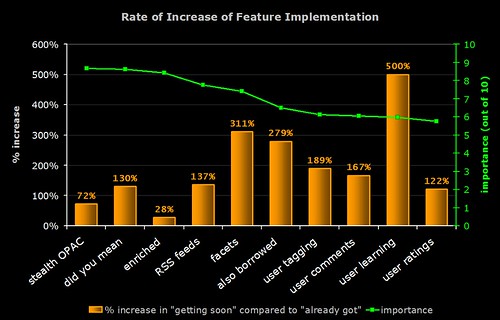
Time for some crystal ball gazing!
The green line (right hand axis) is the average perceived importance of the 10 OPAC features. The orange bar indicates the rate of increase in the implementation of the feature (calculated by dividing the number of people who are planning to implement it by the number of people who already have and expressing the result as a percentage).
For example, 249 respondents already have enriched content and 70 are planning to get it soon:
70 / 249 x 100 = 28.1%
Note that many of the features that (on average) have lower perceived importance are actually the ones whose rate of implementation is highest.
The graph indicates that "learning OPACs" (e.g. OPACs that give the user personalised suggestions and learn from what they do) are potentially the "next big thing"!
4) Feature Importance
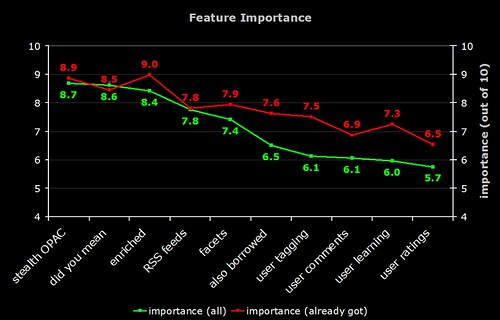
The green line is the average perceived importance of the 10 OPAC features. The red line is the perceived importance from those respondents who have actually implemented that feature.
Note that the difference in the perceived importance of the more "2.0" features (tagging, comments, etc). Does this mean those who have implemented these features are reaping the benefits?
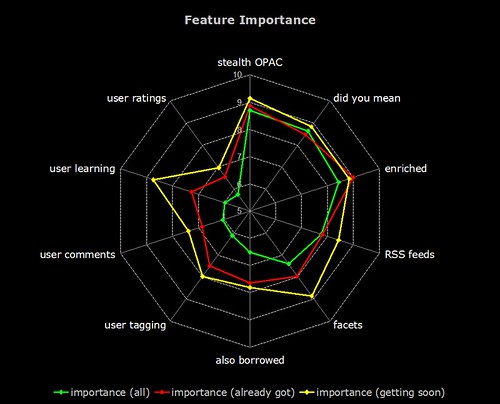
5) Feature Importance
The green line is the average perceived importance of the 10 OPAC features. The faint red line is the perceived importance from those respondents who have actually implemented that feature. The yellow line is the perceived importance from those respondents who are planning to implement that feature soon.
Note that the difference in the perceived importance of the more "2.0" features (tagging, comments, etc). The "getting soon" respondents certainly have high expectations!
And now, the same data on a radar graph (for those who prefer this format)…
6) Feature Implementation (UK)
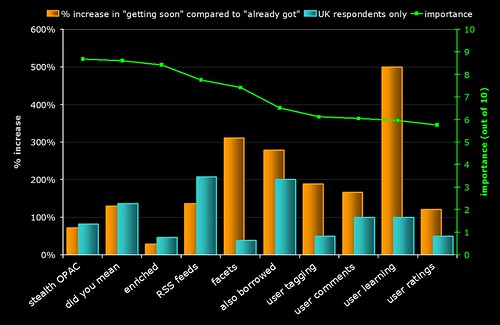
The same graph as (3) but with a blue bar showing the rate of implementation in the UK. Why is faceted browsing so low on the agenda for UK libraries? Are US libraries more aware of this feature due to the high publicity surrounding North Carolina’s OPAC?
2 thoughts on “OPAC Survey results – part 2”
Comments are closed.
Regarding your “Does this mean those who have implemented these features are reaping the benefits?” comment… I’d be more inclined to say that those who have the features were more inclined to rate them highly to begin with, hence why they have them now. It’s rather like saying that those with pierced ears are reaping the benefits because they rate them more highly than those without. (Not that the features wouldn’t be nice, but you can’t assume that it accounts for the ratings.)
Hi Meg
Yep — it was a bit of a throw away remark. Think of it more as a question in a thought bubble above my head 🙂
I suspect you are right. The graph that follows (with the yellow line) I think implies that the respondents who are planning to get the features might have inflated expectations (think of the Gartner “Hype” graph).
I suspect once they’ve actually got those features, the importance ratings would drop so that they are closer to the red line.
However, my own personal experience is that many of the OPAC tweaks we’ve implemented probably wouldn’t have been rated highly by our staff when they were first suggested as possible enhancements. Now that they’re embedded and being used (with some of them generating positive feedback from students and academic staff), our staff would probably give them a higher importance rating.