…sorry, but that was the best blog title I could come up with at 10pm after a long day 😉
In a previous post, I mentioned that the circulation figures were up for the year so far (when compared to 2006). That got me wondering what the long term trend was for items checked out. Unfortunately there are some sizeable gaps in the historical data (as stored on Horizon), otherwise I’d be able to go back as far as 1996.
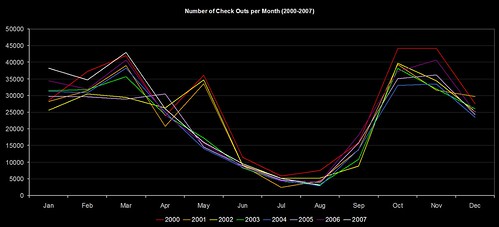
Anyway, here’s how the number of check outs per month pans out since 2000…
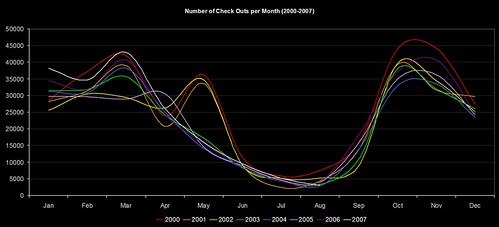
…or if you prefer your lines to be smoother…
The CKO data for this year is in white.
There’s a marked change after 2002 in the period around May, and (if memory serves me right) the structure of our academic year changed in September 2002. The overall figures indicate that we had a slight decline around 2003, but it’s been climbing gradually since then. So, much as I’d love to take the glory for our increased CKOs this year, it’s probably just following the recent trend.
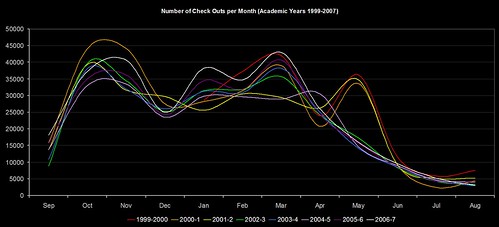
Finally, here’s the same graph, but adjusted for an “academic year” (Sep-Aug)…