I’m just busy putting together slides for some of the upcoming presentations and I thought it was about time I trawled through some of the OPAC usage stats to see if our students are still using some of the OPAC tweaks we’ve made.
The good news is that they are, and then some more!
First up, here’s the overall usage for 4 of the tweaks (May 2006 to July 2007):
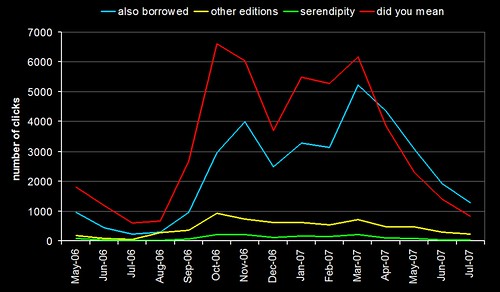
At first glance, nothing too surprising — the overall trend follows the academic year, with the lull over summer.
What did leap out was the blue line (clicks on “people who borrowed this, also borrowed…” suggestions) — since this April, the usage has been higher than the “did you mean” spelling suggestions (red line). So, either our users have suddenly become better spellers, or they’re making much higher usage of the borrowing suggestions. If I was a betting man, I’d say it was the latter.
We’ve now got enough data to compare the same 3 months in 2006 and 2007 (May to July):
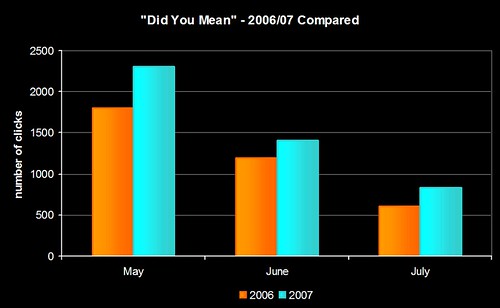
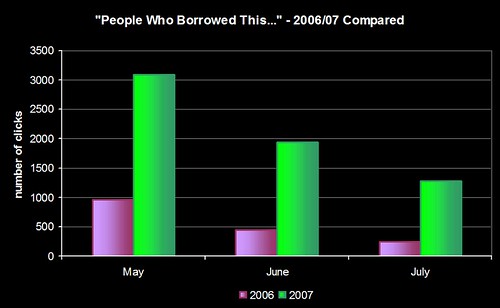
That second graph is why I’m sat here with a grin like a Cheshire Cat 😀
[update]
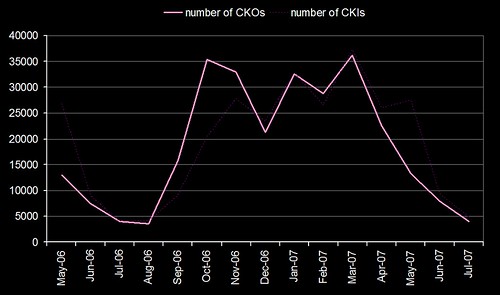
I’ve dug out the circulation stats for the same period and that re-inforces the statement that the students are making much higher usage of borrowing suggestions in 2007 than in 2006. You can see that the number of check outs (bold pink) pretty much matches the number of clicks on the “did you mean” spelling suggestions (red line in the first graph). Check outs have also risen in 2007 when compared to the same months in 2006.
Interestingly, I don’t think we’ve ever had a student go up to a member of staff and say “I’ve found the suggestions really useful” or “thank you for adding spell checking”. I wonder how many complaints we’d get it we turned the features off?