Dewey friend wheel

I’ve been meaning to have a stab at creating something similar to a friend wheel, but using library data, for a while now. Here’s a prototype which uses our “people who borrowed this, also borrowed…” data to try find strong borrowing relationships…
Dewey friends
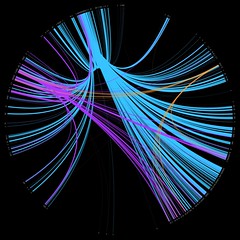
I picked three random Dewey numbers and hacked together a quick PerlMagick script to draw the wheel:

  • 169 – Logic -> Analogy (orange)
  • 822 – English & Old English literatures -> Drama (purple)
  • 941 – General history of Europe -> British Isles (light blue)

The thickness and brightness of the line indicates the strength of the relationship between the two classifications. For example, for people who borrowed items from 941, we also see heavy borrowing in the 260’s (Christian social theology), 270’s (Christian church history), and the 320’s (Political science).
The next step will be to churn through all of the thousand Dewey numbers and draw a relationship wheel for our entire book stock. I’ve left my work PC on to crunch through the raw data overnight, so hopefully I’ll be able to post the image tomorrow.

Dewey Blobs

I’ve been fascinated by data visualisation for a year or two now, and I’ve recently been chatting to my good friend Iman about doing something with our circulation data. In particular, something that will be visually interesting to look at, whilst also giving you a feel for the data.
I’ve tried a few different things, but the Dewey Blobs are currently my favourite…
2008.06.23.ckos
(items borrowed on 23rd June)
The transactions are placed on a 32×32 grid based on their Dewey classification (000-999). Each transaction is shown as a semi-transparent circle with two attributes:
1) colour — based on the School the student making the transaction studies in
2) size — based on the popularity of the book (the larger the circle, the more times it’s been borrowed before)
Where many students from the same school borrow from the same Dewey classification on the same day, the colour is reinforced. If the borrowing is from multiple schools, then the colours begin to blend to create new hues.
For example, on this day the vast majority of transactions in the 300s were by Human & Health students (green)…

…but a couple of days later, the borrowing in the 300s is more complex, with students from several schools appearing (Business students are red and Music & Humanities students are blue)…

You can browse through a few of the blobs on Flickr.