The impact of serendipity (part 2)

I promised I’d dig a bit deeper into the book data, so here goes!
We have seven academic schools in the university, so I thought it would be interesting to see how the range of titles broke down by each school. As previously noted, the borrowing patterns seem to have changed at the end of 2005/start of 2006, so here’s the percentage change for the two periods…

academic school       average range of titles borrowed    % change
                            2000-2005        2006-2008
Music, Humanities & Media      16,760           20,468      122.1%
Business                        9,431           11,402      120.9%
Computing & Engineering         7,033            6,771       96.3%
Education                      12,485           11,909       95.4%
Human & Health Sciences        16,427           20,274      123.4%
Applied Sciences                7,356            7,562      102.8%
Art, Design & Architecture      9,361           12,309      131.4%

So, first of all, the increase in range of titles being borrowed isn’t across the board. I knew Computing & Engineering borrowing had been in decline for a number of years, but I’m surprised to see that the same applies for Education. Applied Sciences has stayed pretty much the same, but the other 4 schools have seen sizeable increases in the range of titles being borrowed.
The Art & Design section of the library was revamped in 2005, so it could be that we’ve seen an increase in the number of students using the library and that has driven the increased borrowing since then for that school.
A few of the comments suggested that loans per borrower would be a useful metric. Unfortunately I don’t have the data for the total number of students in each school per year, so I’m using the total number of active borrowers instead…

academic school      average loans per active borrower    % change
                            2000-2005        2006-2008
Music, Humanities & Media        26.1             25.7       98.6%
Business                         10.2             12.3      121.4%
Computing & Engineering           8.3              7.7       93.6%
Education                        15.1             14.0       92.8%
Human & Health Sciences          15.3             18.8      122.6%
Applied Sciences                 11.8             13.3      112.1%
Art, Design & Architecture       10.6             10.4       98.4%

Again a decline in Computing and Education. Art & Design and Music & Humanities have remained pretty much the same. The other 3 schools have seen an increase in the number of loans per active borrower.
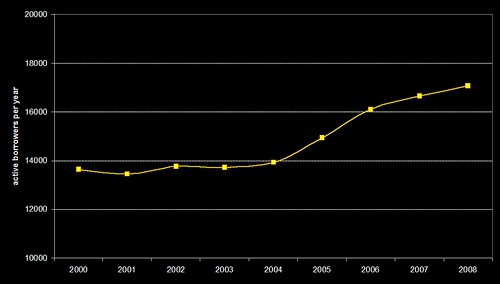
One final set of data — the number of active borrowers per school…

academic school    average active borrowers per school    % change
                                2000-2005    2006-2008
Music, Humanities & Media           1,537        1,976      128.5%
Business                            2,557        2,963      115.8%
Computing & Engineering             1,650        1,527       92.5%
Education                           1,526        1,988      130.3%
Human & Health Sciences             3,587        4,581      127.7%
Applied Sciences                    1,267        1,243       98.1%
Art, Design & Architecture          1,621        2,332      143.9%

It looks like there are a couple of things going on here…
1) In the last 3 years, the number of active borrowers (i.e. users who have borrowed at least one item) has increased. In the period 2000-2004, the total number of active student borrowers was relatively static (around 14,000) and since 2005 it’s been on the increase (with just over 17,000 in 2008).
2) Overall, there’s an increase in the average number of books borrowed per active borrower, primarily driven by the two schools with the highest number of active borrowers (Business and Human & Health). The increases in those two schools more than offsets the decreases seen in a couple of the other schools (Computing and Education).
At a time when some other UK academic libraries have reported a decrease in borrowing, both of the above are good news for our library. I’ll need to go back to the SCONUL stats to check, but I don’t think we’ve seen much of an increase in book stock in the last decade (I suspect it might actually have decreased).
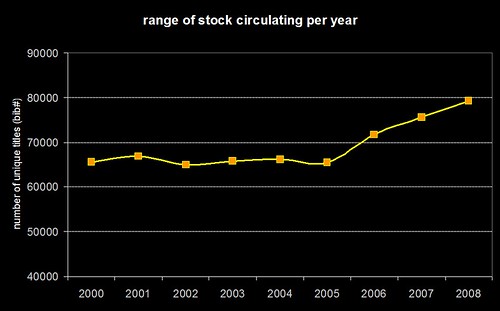
So, can we actually say anything about the impact of serendipity? If we look in more depth at the average number of books borrowed per active borrower per year for all students, we get this…
loansperactiveborrower
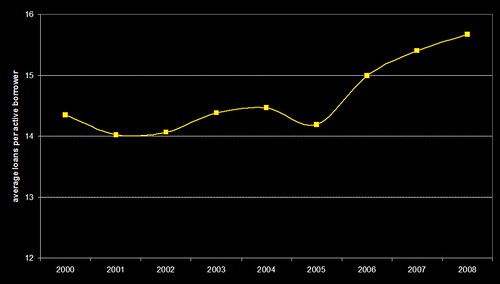
…which closely resembles the original graph from the first post showing the range of unique titles borrowed per year…
interesting
…and the number of active borrowers per year also shows a similar trend…
activeborrowers
It’s obvious that there’s a driver in there somewhere which has caused the average number of loans per active borrower to increase since 2005. Hand-in-hand there’s been a similar increases in the range of stock that’s being borrowed and the number of active borrowers.
As more people use the library, one would perhaps expect the range of stock being borrowed to increase. However, would you also expect the average number of loans per borrower to increase (bearing in mind that the stock levels have probably not increased and may have actually decreased during that period)?
I’m still not entirely sure I’ve shown that adding serendipity to an OPAC increases the range of stock being borrowed (that’s probably more influenced by the number of active borrowers), but there may well be a link with the average number of books loaned to each borrower.
Now, to change the topic, here’s one final graph that I included in the UKSG presentation — it shows the number of clicks per month on the books in the OPAC’s virtual shelf browser
virtualshelfbrowser
…seeing as this was just an experimental feature that added a bit of “book cover eye candy” to the OPAC, I’m amazed how heavily it’s being used. Whilst fixing one of our dedicated catalogue PCs in the library on Friday, I noticed that a student was carrying out a search, then picking a relevant search result, then using the shelf browser to look at all of the nearby books. And to think I’m usually dismissive of the benefits of browsing within OPACs 😀

A library dating service

In my UKSG presentation, I briefly touched on the need for library services (perhaps the OPAC, but perhaps not) to start joining users together in the same way that sites like Facebook do.
In the same way that a “people who borrowed this, also borrowed…” service starts exposing the hidden links between items on shelves, I think we need to start finding the connections between our users.
Using circulation data, we can start to locate clusters of users who’ve borrowed the same books. In an academic environment, these may be students who are studying on the same course. However, what if we discovered that two separate courses being run in different parts of the university had a strong overlap in borrowing? Would value be gained from introducing those students to each other?
No sooner had I tweeted that I was thinking about this kind of thing, Tony Hirst sent a response

…a library dating service, then? Heh heh 😉

I’m keen to know what your first reaction to Tony’s comment is!
What if you were a lonely researcher who wanted to find someone similar to yourself, in order to collaborate on a project? By mining the circulation data and/or OpenURL article access data, a library could find your ideal partner — someone who’d been looking at the same books and resources that you’d been using. If libraries were aggregating their usage data at a national level, that perfect partner could well be a researcher at another institution.
To test this out, I tweaked our “people who borrowed this” code to generate the links between users (rather than the books). As an aside, I’ve been trying all day to figure out what the user equivalent of “people who borrowed this, also borrowed…” is, but haven’t been able to wrap my head around the logical linguistics of it!
Data Protection obviously means that I can share that prototype with you, but it did throw up some interesting results. For my partner Bryony, her closest match was one of her colleagues who works in the same department as her — they both share similar craft related interests, so have borrowed similar books. However, what if her closest match was someone working in another department? Maybe they’d want to meet up over a coffee and swap crafty ideas.
I also tried the same for one of my colleagues, who’s a lecturer, and found that his ideal match is himself! Or rather, the closest match for his current library account (as a member of staff) was his old library account from when he was a student. In other words, since becoming a lecturer, he’s re-borrowed quite a few of the books he used as a student.
Although I can’t show you the data for individuals, we can step back a level and look at the borrowing at the course level. I’ve put together a quick and dirty prototype to play with. The prototype will pick a course at random and then show the courses that have the closest matches in terms of book borrowing — if you’re unlucky and get an empty list (i.e. no matches were found), try refreshing the page.
Taking the BSC Applied Criminology course as an example — 59.3% of the books borrowed by students on that course were also borrowed by students on the BSC Behavioural Sciences course (HB100). The other top matches all seem to be related to criminology: psychology, social work, police studies, child protection, probation work, etc. However, there also appears to be some synergy with books borrowed by midwifery, history and hospitality management students.
I’ll try and add some extra code in tomorrow to show what the most popular books are that inhabit those course intersections.

The impact of book suggestions/recommendations?

Whilst finalising my presentation for the 2009 UKSG Conference in Torquay, I thought it would be interested to dig into the circulation data to see if there was any indication that our book recommendation/suggestion services (i.e. “people who borrowed this, also borrowed…” and “we think you might be interested in…”) have had any impact on borrowing.
Here’s a graph showing the range of stock that’s being borrowed each calendar year since 2000…
interesting
Just to be clear — the graph isn’t showing the total number of items borrowed, it’s the range of unique titles (in Horizon speak, bib numbers) that have been borrowed. If you speak SQL, then we’re talking about a “count(distinct(bib#))” type query. What I don’t have to hand is the total number of titles in stock for each year, but I’d hazard a guess that it’s been fairly constant.
You can see that from 2000 to 2005, borrowing seems to have been limited to a range of around 65,000 titles (probably driven primarily by reading lists). At the end of 2005, we introduced the “people who borrowed this, also borrowed…” suggestions and then, in early 2006, we added personalised “we think you might be interested in…” suggestions for users who’ve logged into the OPAC.
Hand on heart, I wouldn’t say that the suggestions/recommendations are wholly responsible for the sudden and continuing increase in the range of stock being borrowed, but they certainly seem to be having an impact.
Hand-in-hand with that increase, we’ve also seen a decrease in the number of times books are getting renewed (even though we’ve made renewing much easier than before, via self-issue, telephone renewals, and pre-overdue reminders). Rather than hanging onto a book and repeatedly renewing it, our students seem to be exploring our stock more widely and seeking out other titles to borrow.
So, whilst I don’t think there’s a quick any easy way of finding out what the true impact has been, I’m certainly sat here with a grin like a Cheshire cat!

Mash Oop North

Coming this summer…
mashuplibrary2009
We’re hoping to fix the date soon, but it’s likely to be on or around Tuesday July 7th at the University of Huddersfield.
If it is July 7th, then we’d be able to celebrate:

…that both events occurred on July 7th is not a coincidence 😉
(mashed potato courtesy of jslander)

3 Million

Aaron’s cool Wordle visualisations prompted me to have a look at our ever growing log of OPAC keyword searches (see this blog post from 2006). We’ve been collecting the keyword searches for just over 2.5 years and, sometime within the last 7 days, the 3 millionth entry was logged.
Not that I ever need an excuse to play around with Perl and ImageMagick, but hitting the 3 million mark seemed like a good time to create a couple of images…
file6_good
file7_good
The only real difference between the two is the transparency/opacity of the words. In both, the word size reflects the number of times it has been used in a search and the words are arranged semi-randomly, with “a”s near the top and “z”s near the bottom.
If I get some spare time, it’ll be interesting to see if there are any trends in the data. For example, do events in the news have any impact on what students search for?
The data is currently doing a couple of things on our OPAC
1) Word cloud on the front page, which is mostly eye candy to fill a bit of blank space
2) Keyword combination suggestions — for example, search for “gothic” and you should see some suggestions such as “literature”, “revival” and “architecture”. These aren’t suggestions based on our holdings or from our librarians, but are the most commonly used words from multi keyword searches that included the term “gothic”.
..and, just for fun, here’s the data as a Wordle:
wordle2
wordle1

ITV Unforgiven – campus shots

Following on from the last blog post, here’s some of the “on-campus” photos…
snapshot20090128182906.jpg
(that naughty faked “York” signage)
snapshot20090128183817
(Quayside, staged to look like a student cafeteria)
snapshot20090128184323 snapshot20090128184333
(The Art & Design section of the Main Library — apparently the few seconds of footage that appeared in the final programme took 3 hours to shoot!)
snapshot20090128184210
(St Paul’s Hall — a venue that attendees of the world famous Huddersfield Contemporary Music Festival will be familiar with)
snapshot20090128183905 snapshot20090128184223
(outside the Creative Arts Building — the foundation stone was unveiled by The Queen in 2007)
snapshot20090128184014
(inside the Creative Arts Building, with St Paul’s Hall in the background)
snapshot20090128184155 snapshot20090128184342
(Storthes Hall, student accommodation)

Hey up — we’re on TV!

The last episode of “Unforgiven” (IMDB) has just finished, and it featured quite a bit of footage filmed on-campus at the University of Huddersfield — mostly in the new Creative Arts Building, opposite the library…
floor6_017
However, if you watched the programme, you probably spotted that the TV production crew covered up the University of Huddersfield signage and replaced it with “University of York”. They even used the same font and design as York!!!
I’m not sure if there’s anyone from York reading this blog, but I’m curious to know what exactly happened. Presumably the University of York gave the production company permission to use their corporate branding? If so, why didn’t they just do the filming at York in the first place? I’m also surprised that the top brass at Huddersfield gave the production company permission to dress our University as another one — especially one that wasn’t a fictional university :-S
Anyway, if you did watch the final episode, the parts where Ruth Slater (played by Suranne Jones) followed her sister (Emily Beecham) to the university were filmed at Huddersfield in the Creative Arts Building and in the Quayside area of the Central Services Building.

Free book usage data from the University of Huddersfield

I’m very proud to announce that Library Services at the University of Huddersfield has just done something that would have perhaps been unthinkable a few years ago: we’ve just released a major portion of our book circulation and recommendation data under an Open Data Commons/CC0 licence. In total, there’s data for over 80,000 titles derived from a pool of just under 3 million circulation transactions spanning a 13 year period.
https://library.hud.ac.uk/usagedata/
I would like to lay down a challenge to every other library in the world to consider doing the same.
This isn’t about breaching borrower/patron privacy — the data we’ve released is thoroughly aggregated and anonymised. This is about sharing potentially useful data to a much wider community and attaching as few strings as possible.
I’m guessing some of you are thinking: “what use is the data to me?”. Well, possibly of very little use — it’s just a droplet in the ocean of library transactions and it’s only data from one medium-sized new University, somewhere in the north of England. However, if just a small number of other libraries were to release their data as well, we’d be able to begin seeing the wider trends in borrowing.
The data we’ve released essentially comes in two big chunks:
1) Circulation Data

This breaks down the loans by year, by academic school, and by individual academic courses. This data will primarily be of interest to other academic libraries. UK academic libraries may be able to directly compare borrowing by matching up their courses against ours (using the UCAS course codes).

2) Recommendation Data

This is the data which drives the “people who borrowed this, also borrowed…” suggestions in our OPAC. This data had previously been exposed as a web service with a non-commercial licence, but is now freely available for you to download. We’ve also included data about the number of times the suggested title was borrowed before, at the same time, or afterwards.

Smaller data files provide further details about our courses, the relevant UCAS course codes, and expended ISBN lookup indexes (many thanks to Tim Spalding for allowing the use of thingISBN data to enable this!).
All of the data is in XML format and, in the coming weeks, I’m intending to create a number of web services and APIs which can be used to fetch subsets of the data.
The clock has been ticking to get all of this done in time for the “Sitting on a gold mine: improving provision and services for learners by aggregating and using learner behaviour data” event, organised by the JISC TILE Project. Therefore, the XML format is fairly simplistic. If you have any comments about the structuring of the data, please let me know.
I mentioned that the data is a subset of our entire circulation data — the criteria for inclusion was that the relevant MARC record must contain an ISBN and borrowing must have been significant. So, you won’t find any titles without ISBNs in the data, nor any books which have only been borrowed a couple of times.
So, this data is just a droplet — a single pixel in a much larger picture.
Now it’s up to you to think about whether or not you can augment this with data from your own library. If you can’t, I want to know what the barriers to sharing are. Then I want to know how we can break down those barriers.
I want you to imagine a world where a first year undergraduate psychology student can run a search on your OPAC and have the results ranked by the most popular titles as borrowed by their peers on similar courses around the globe.
I want you to imagine a book recommendation service that makes Amazon’s look amateurish.
I want you to imagine a collection development tool that can tap into the latest borrowing trends at a regional, national and international level.
Sounds good? Let’s start talking about how we can achieve it.


FAQ (OK, I’m trying to anticipate some of your questions!)
Q. Why are you doing this?
A. We’ve been actively mining circulation data for the benefit of our students since 2005. The “people who borrowed this, also borrowed…” feature in our OPAC has been one of the most successful and popular additions (second only to adding a spellchecker). The JISC TILE Project has been debating the benefits of larger scale aggregations of usage data and we believe that would greatly increase the end benefit to our users. We hope that the release of the data will stimulate a wider debate about the advantages and disadvantages of aggregating usage data.
Q. Why Open Data Commons / CC0?
A. We believe this is currently the most suitable licence to release the data under. Restrictions limit (re)use and we’re keen to see this data used in imaginative ways. In an ideal world, there would be services to harvest the data, crunch it, and then expose it back to the community, but we’re not there yet.
Q. What about borrower privacy?
A. There’s a balance to be struck between safeguarding privacy and allowing usage data to improve our services. It is possible to have both. Data mining is typically about looking for trends — it’s about identifying sizeable groups of users who exhibit similar behaviour, rather than looking for unique combinations of borrowing that might relate to just one individual. Setting a suitable threshold on the minimum group size ensures anonymity.