Technically today is the last day of my “old job”, which saw me based with the Business Applications Team in Computing Services at the University of Huddersfield. From Monday, I’m still the “Library Systems Manager”, but I’ll be moving up to join colleagues in the Technical Services Team in the Library.
My new role will be less about systems admin and hardware troubleshooting, and much more about development, programming and improving access to e-resources.
And that’s not the only change around here — phase 2 of the 3 year refurbishment of the University Library is nearly complete. I’ll be posting some photos next week, but the refurbished subject floors look fantastic!!! It’s hard to believe it looked like this a few weeks ago…
Tag: huddersfield
“Oh-oh dedication’s what you need…
…if you wanna be a record break-er, oooooh!” (full lyrics)
I’m not sure if the University of Huddersfield has ever made an appearance in the Guinness book of World Records before, but it looks like we should be in the next edition!

Students from the University’s Department of Chemical & Biological Sciences teamed up with about 60 sixth-form students from local schools and colleges to beat the record in just under one hour, following a morning of intensive coaching and training. The record-breaking model measures 21.5 m (70 feet 6 inches) and exactly copies the genetic code for human insulin. It is the world’s largest model and consists of 1,118 ‘base pairs’, compared with the previous world record, which was a random sequence of about 300 base pairs.

Major kudos to everyone involved!!!
I am reliant on Bloglines
Well, it turns out I am reliant on Bloglines when it comes to finding out what’s going on 😀
Little did I know that my work colleagues have been busy uploading photos to Flickr behind my back! I’ll hopefully be bumping into a few of them at the Beer Festival in Holmfirth on Saturday, so I’ll be quizzing them about these images 🙂


Dewey Blobs
I’ve been fascinated by data visualisation for a year or two now, and I’ve recently been chatting to my good friend Iman about doing something with our circulation data. In particular, something that will be visually interesting to look at, whilst also giving you a feel for the data.
I’ve tried a few different things, but the Dewey Blobs are currently my favourite…
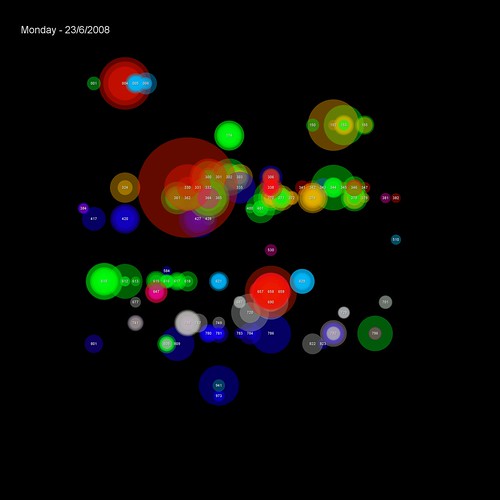
(items borrowed on 23rd June)
The transactions are placed on a 32×32 grid based on their Dewey classification (000-999). Each transaction is shown as a semi-transparent circle with two attributes:
1) colour — based on the School the student making the transaction studies in
2) size — based on the popularity of the book (the larger the circle, the more times it’s been borrowed before)
Where many students from the same school borrow from the same Dewey classification on the same day, the colour is reinforced. If the borrowing is from multiple schools, then the colours begin to blend to create new hues.
For example, on this day the vast majority of transactions in the 300s were by Human & Health students (green)…

…but a couple of days later, the borrowing in the 300s is more complex, with students from several schools appearing (Business students are red and Music & Humanities students are blue)…

You can browse through a few of the blobs on Flickr.
Google Graphs
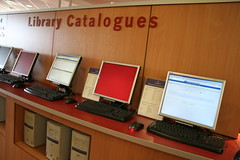
We’ve had loan data on the OPAC for a couple of years now, although it’s only previously been visible to staff IP addresses. Anyway, a couple of months ago, I revamped it using Google Graphs and I’ve finally gotten around to adding a stats link that anyone can peruse — you should be able to find it in the “useful links” section at the foot of the full bib page on our OPAC.
As an example, here are the stats for the 2006 edition of Giddens’ “Sociology“…
Where did all the books go?
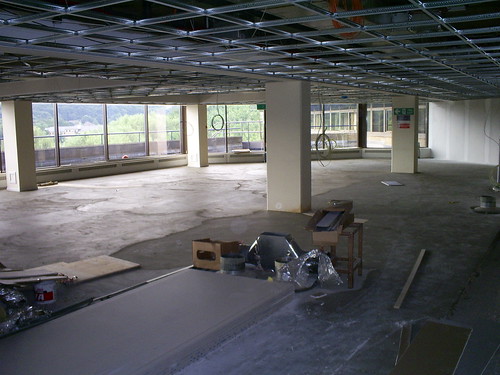
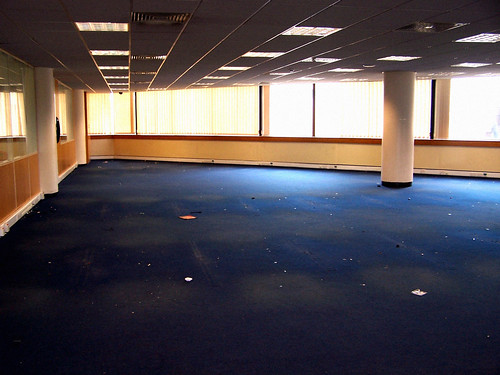
The University of Hudderfield Library is entering into the 2nd phase of a 3 year refurbishment. Last year, it was the entrance floor, and this year it’s the two subject floors above. Floor 5 is already cleared of stock, and floor 6 will be empty by the end of next week.
I couldn’t resist spending a few minutes wandering around the deserted floor 5 this afternoon. Most times of the year, it’s a vibrant and busy subject floor — today is was eiree and desolate. With the shelving and staff gone, you get a real sense of the space and size…
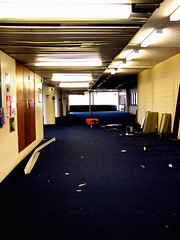
The floor of the former PC room is dotted with circular patches where the culmulative effect of hundreds of students on PC swivel chairs has gradually worn away the carpet. It’s like something out of a sci-fi film where people get zapped and turned into a small round pile of ash 😉
You can find the rest of the photos here.


2008 — The Year of Making Your Data Work Harder
Quite a few of the conversations I’ve had this year at conferences and exhibitions have been about making data work harder (it’s also one of the themes in the JISC “Towards Implementation of Library 2.0 and the E-framework” study). We’ve had circ driven borrowing suggestions on our OPAC since 2005 (were we the first library to do this?) and, more recently, we’ve used our log of keyword searches to generate keyword combination suggestions.
However, I feel like this is really just the tip of the iceberg — I’m sure we can make our data work even harder for both us (as a library) and our users. I think the last two times I’ve spoken to Ken Chad, we’ve talked about a Utopian vision of the future where libraries share and aggregate usage data 😀
There’s been a timely discussion on the NGC4Lib mailing list about data and borrower privacy. In some ways, privacy is a red herring — data about a specific individual is really only of value to that individual, whereas aggregated data (where trends become apparent and individual whims disappear) becomes useful to everyone. As Edward Corrado points out, there are ways of ensuring patron privacy whilst still allowing data mining to occur.
Anyway, the NGC4Lib posts spurred me on into finishing off some code primarily designed for our new Student Portal — course specific new book list RSS feeds.
The way we used to do new books was torturous… I’ve thankfully blanked most of it out of my memory now, but it involved fund codes, book budgets, Word marcos, Excel and Borland Reportsmith. The way we’re trying it now is to mine our circulation data to find out what students on each course actually borrow, and use that to narrow down the Dewey ranges that will be of most interest to them.
The “big win” is that our Subject Librarians haven’t had to waste time providing me with lists of ranges for each course (and with 100 or so courses per School, that might takes weeks). I guess the $64,000 question is would they have provided me with the same Dewey ranges as the data mining did?
The code is “beta”, but looks to be generating good results — you can find all of the feeds in this directory: https://library.hud.ac.uk/data/rss/courses/
If you’d like some quick examples, then try these:
- Entrepreneurship MSc (course details)
- Management by Action Learning MA (course details)
- Youth and Community Work BA(Hons) (course details)
- Performing Arts (Performance) FdA (course details)
- Early Primary Education BA(Hons) (course details)
- Logistics and Supply Chain Management BSc(Hons) (course details)
- Fashion Design (Top-up) BA(Hons) (course details)
- Product Design BA/BSc(Hons) (course details)
Is your data working hard enough for you and your users? If not, why not?
decorative tag cloud
It’s not often that I’d consider adding pure “eye candy” to the OPAC, but I couldn’t decide what would be the best way of making this tag cloud functional. So, I made an executive decision and decided it shouldn’t be functional 😀
If you run a keyword search on our OPAC, at the foot of the page you should see a keyword cloud (it might take a few seconds to appear). The cloud is generated from previous keyword searches used on our OPAC. Here’s the one for “library“…
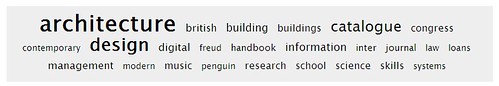
For multi-keyword searches, an electronic coin is tossed and you either get a cloud of the union or the intersection of your keywords. The former uses previous searches that contain any of the keywords, and the later is only those that contain all of them (if that makes sense!)
As it’s not functional, the cloud is just a decorative window into the hive mind of our users.
I’m interested to hear what you think — should the cloud be functional, or does it work as just “eye candy”?
Congratulations “City of God” DVD!
Sitting in the Short Loan collection in the main library at the University of Huddersfield, it doesn’t really stand out as been any different to the other DVDs near it, but our copy of “City of God” is officially the most borrowed item from our entire collection (which is nearly 400,000 items) in the last 3 years.
It’s not quite as popular as it once was (the number of loans in 2007 was about half of the 2005 figure), but it’s now been borrowed 157 times since it first arrived here in 2004.
The most borrowed book was one of the copies of “Research methods for business students“, which has now been borrowed 118 times since it was first placed on our shelves.
Anyway, if you were thinking of rushing here to borrow “City of God”, sorry — it’s out on loan at the moment 🙂
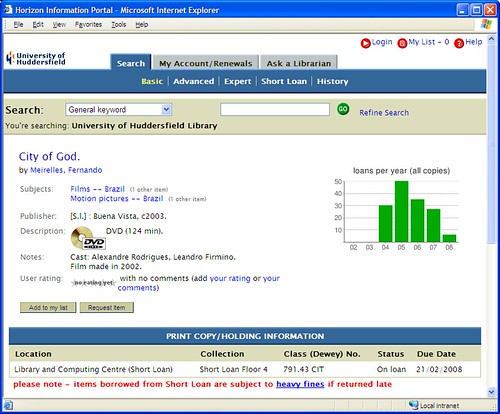
(if you were wondering, then “yes, that’s a Google Chart“)
Ooops – did I just delete the LMS database?
I’m always wary of doing bulk changes to the bibliographic records via SQL, so I tend to be fairly cautious.
Anyway, we’d got nearly 100,000 bib records that need rejiggering (ISBN in the wrong field), so I knocked up a Perl script to do the deed. After it had changed a few hundred records, I connected to the database and ran the following SQL…
set rowcount 10
select * from bib where tag = “011”
The last thing I want to do is pull back everything with a 011 tag, so the “set rowcount” ensures only the first 10 results are returned. The output looks good, so I decide to check the size of the transaction log…
sp_dbspace
We use Sybase and that command shows the size of the main LMS database and the transaction log. The transaction log size looks fine and I minimise the window. However, my subconscious shouts out “something’s wrong!”, so I maximise the SQL window and look at the output again…
name: horizon
data MB: 5500.00
used MB: 54.68
percent: 0.99%
log MB: 300.00
log used MB: 88.40
log pct: 29.47%
My eyes automatically jump to the end of the output: “So, the transaction log is 29.47% full… that’s nothing to worry about…”
My eyes then wander up and my brain takes about 2 seconds to spot what’s really wrong — our entire LMS database is just 54.68MB!!! “That can’t be right… it should be at least 4,800MB!!!”
The colour drains from my face as the possibility that one of the SQL commands in my Perl script has nuked our entire database enters my mind. I sit motionless in my chair waiting for the inevitable phone call from a member of staff: “Dave… is there something wrong with Horizon?”
Then, in the space of about 30 seconds, I go through all seven stages of grief…
1) shock (“I can’t believe this has happened”)
2) denial (“maybe someone else did it?”)
3) bargaining (“I wonder if I can bribe someone else to take the blame?”)
4) guilt (“OMG — IT’S ALL MY FAULT!!!”)
5) anger (“damn it — this didn’t happen when I ran the script on the test database!”)
6) depression (“this won’t sound good when I apply for a new job and they asked me why I was fired from my previous job”)
7) acceptance and hope (“the time is right for a major career change”)
…so, can anyone guess what happened next?