Sitting in the Short Loan collection in the main library at the University of Huddersfield, it doesn’t really stand out as been any different to the other DVDs near it, but our copy of “City of God” is officially the most borrowed item from our entire collection (which is nearly 400,000 items) in the last 3 years.
It’s not quite as popular as it once was (the number of loans in 2007 was about half of the 2005 figure), but it’s now been borrowed 157 times since it first arrived here in 2004.
The most borrowed book was one of the copies of “Research methods for business students“, which has now been borrowed 118 times since it was first placed on our shelves.
Anyway, if you were thinking of rushing here to borrow “City of God”, sorry — it’s out on loan at the moment 🙂
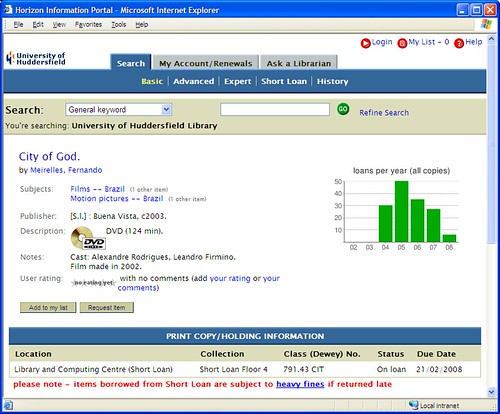
(if you were wondering, then “yes, that’s a Google Chart“)
Category: Usage Data
“Spin, spin, spin the Wheel of Justice…”
Kudos if you automatically sang to yourself “…see how fast the bastard turns” 😉
If you’ve no idea what I’m on about, then YouTube is your friend.
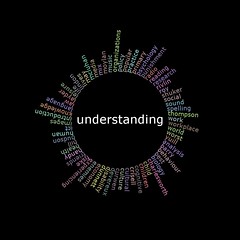
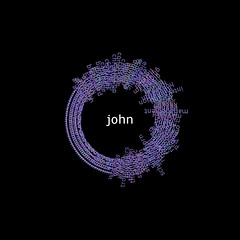
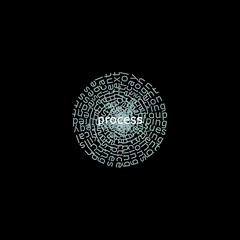
Anyway, I got to playing around with the OPAC keyword cloud data and ImageMagick and came up with this (reload that web page to get a new image)…

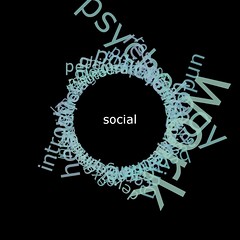
I was struggling to remember how to find the points on the circumference of a circle until I remembered that one of the chapters in the original ZX Spectrum manual covered the topic.
The word in the middle is chosen at random from the top 200 most popular keywords used on our OPAC and the surrounding words at those most commonly used with that word.
OPAC keyword cloud
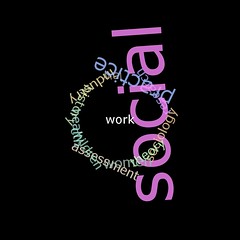
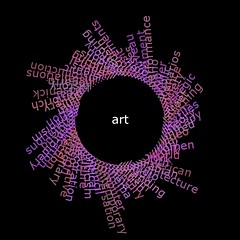
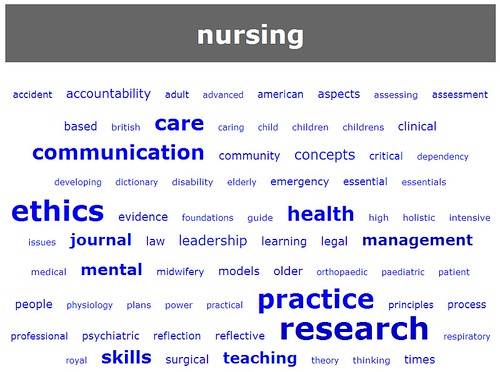
This is crying out to be done like the visual word map in AquaBrowser, but here’s a browseable tag cloud based on data from nearly 2 million keyword searches on our OPAC.
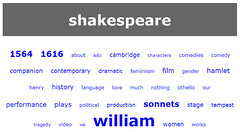
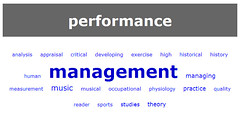
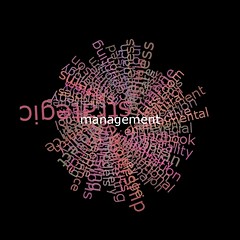
The code looks for other keywords that were entered as part of the same search (e.g. “ethics of nursing care”) to draw out the most commonly used words. For example, the most common keyword used with “performance” is “management”. The size of the word in the cloud is determined by how often it appears with the search keyword.
I’ve not removed keywords that generated zero search results, so the cloud for “acrobat” includes “abode”. (I’ve now removed zero result searches)
I’ll have to have a play to see if there’s a way of incorporating the cloud into the OPAC — for example, if you used a vague/general keyword such as “health“, then maybe the OPAC could suggest more specific searches for “health care”, “mental health” or “health promotion”?
Check out these trends
…sorry, but that was the best blog title I could come up with at 10pm after a long day 😉
In a previous post, I mentioned that the circulation figures were up for the year so far (when compared to 2006). That got me wondering what the long term trend was for items checked out. Unfortunately there are some sizeable gaps in the historical data (as stored on Horizon), otherwise I’d be able to go back as far as 1996.
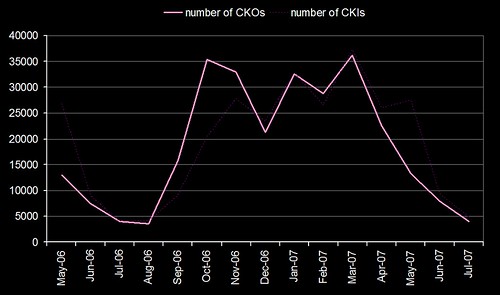
Anyway, here’s how the number of check outs per month pans out since 2000…
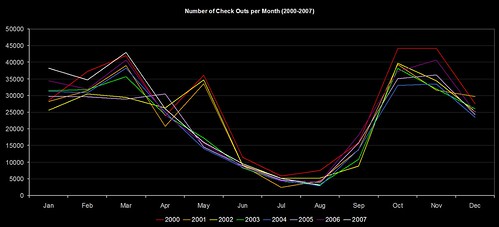
…or if you prefer your lines to be smoother…
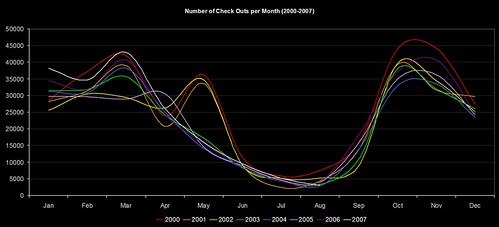
The CKO data for this year is in white.
There’s a marked change after 2002 in the period around May, and (if memory serves me right) the structure of our academic year changed in September 2002. The overall figures indicate that we had a slight decline around 2003, but it’s been climbing gradually since then. So, much as I’d love to take the glory for our increased CKOs this year, it’s probably just following the recent trend.
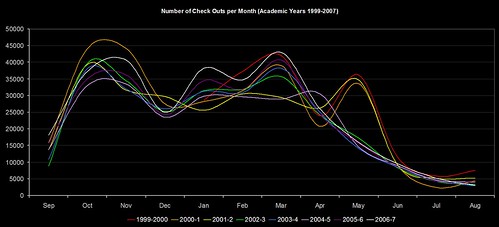
Finally, here’s the same graph, but adjusted for an “academic year” (Sep-Aug)…
If you build it, they’ll come back for more!
I’m just busy putting together slides for some of the upcoming presentations and I thought it was about time I trawled through some of the OPAC usage stats to see if our students are still using some of the OPAC tweaks we’ve made.
The good news is that they are, and then some more!
First up, here’s the overall usage for 4 of the tweaks (May 2006 to July 2007):
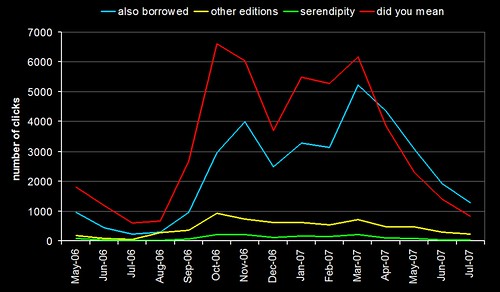
At first glance, nothing too surprising — the overall trend follows the academic year, with the lull over summer.
What did leap out was the blue line (clicks on “people who borrowed this, also borrowed…” suggestions) — since this April, the usage has been higher than the “did you mean” spelling suggestions (red line). So, either our users have suddenly become better spellers, or they’re making much higher usage of the borrowing suggestions. If I was a betting man, I’d say it was the latter.
We’ve now got enough data to compare the same 3 months in 2006 and 2007 (May to July):
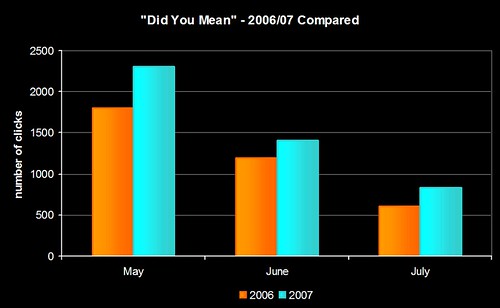
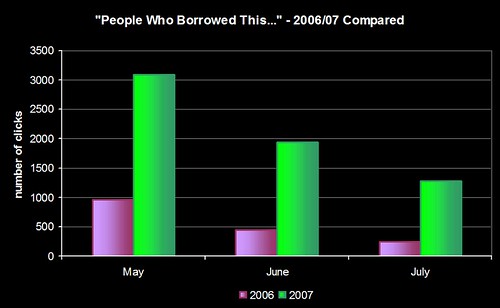
That second graph is why I’m sat here with a grin like a Cheshire Cat 😀
[update]
I’ve dug out the circulation stats for the same period and that re-inforces the statement that the students are making much higher usage of borrowing suggestions in 2007 than in 2006. You can see that the number of check outs (bold pink) pretty much matches the number of clicks on the “did you mean” spelling suggestions (red line in the first graph). Check outs have also risen in 2007 when compared to the same months in 2006.
Interestingly, I don’t think we’ve ever had a student go up to a member of staff and say “I’ve found the suggestions really useful” or “thank you for adding spell checking”. I wonder how many complaints we’d get it we turned the features off?
Hey, whatcha lookin’ at?
Just for the heck of it, I’ve started logging details of the full bib pages displayed in the OPAC to get a feel for what are the most looked at books. Once we’ve got enough data, it’ll be interesting to cross reference that with the actual number of physical copies we own for each title and whether or not a copy was checked out shortly after it was looked at.
In the meantime, here’s another “wall of books” to feast your eyes on…
top 50 most looked at books on the OPAC in the last 7 days
(I don’t have 7 days of data yet, but not to worry!)
Heh – glad to see the following funky book made it into the initial top 50 🙂

“Spooky” and “Eureka!” moments
Just spotted “Asking Non-Users Why They Don’t Use the Library” (LISNews):
From the Newtown (CT) Bee, C.H. Booth Library is looking for opinions about the library from an unlikely source: the people who do not use it. As part of a study for long-range planning at the library, made possible through a $9,000 grant awarded in 2006 by the Connecticut State Library, consultants Kevin McCarthy, director of Perrot Library in Old Greenwich and Christine Bradley, Connecticut Library Consortium executive director, have created a survey for local residents. To date, more than 300 surveys have been returned, a return rate that Mr McCarthy said at a meeting January 9 is very good.
At Huddersfield, we’ve been busy trawling our usage stats — firstly for our initial Equality Impact Assessment of opening hours, and more recently an analysis of non and low usage by staff and students.
We’ve only done an quick overview of non-usage (specifically usage of electronic resources, library borrowing, and number of visits to the library), but it’s thrown up some interesting trends such as:
1) Art & Design Students — only 20% of them regularly use our electronic resources, but (relatively speaking) they are heavy users of the library (visits and borrowing)
2) the older you are (apparently we’re not allowed to say “Mature Students” anymore), the less likely you are to use the library and it’s facilities — the drop off rate is fairly alarming, especially as we have a large number of students who didn’t come to us straight from doing their A Levels
3) female students are more likely to borrow books than males, but are less likely to make use of the library outside of the normal 9-5 opening hours
Continue reading ““Spooky” and “Eureka!” moments”
using “circ_tran” to show borrowing suggestions in HIP
One of the things we’re trying to do this year at Huddersfield is to make better use of our data archives:
…as each student goes through a library turnstile, data is written away…
…as each student borrows a book, more data is quietly written away…
…as each student uses an electronic resource, data is written away…
…as each student logs onto a PC, yet another piece of data is…
…okay, enough already – you get the idea!
We’re not particularly interested in what an individual student has done, but we’d like to see the broader pictures. For example, we open the Library 24/7 at certain times of the year (e.g. Easter) – we’d like to know more about the kinds of students who come in late at night and leave early the next morning:
- are certain ethnic groups more likely to use the Library outside of the standard opening hours?
- do we get more male or female students using the Library in the wee small hours?
- are students coming in to use the computers, to issue/return items, or to sit quietly in a corner and study?
The answers to those kinds of questions tend to be found in several databases. The Sentry database tells us when someone entered the Library, but it doesn’t tell us if they are male or female, Asian or Caucasian – that kind is information is stored in the Student Records System. Also, the Sentry database doesn’t tell us what the student actually did – Circ transactions are in Horizon and PC usage info is stored in other databases.
So, long term we’re looking at ways of trying to combine data from all of those sources into meaningful and enlightening stats.
“What has this got to do with showing borrowing suggestions in HIP?”, I hear you ask!
Well, once I’d had a hunt around in our circ_tran table in Horizon, it seemed like a great use of all that historical Circ data would be to do an Amazon-like “patrons who borrowed this book also borrowed…”.
Before I proceed with the “how to”, I’ve got a hunch that not everyone has got a circ_tran table – it might be something that SirsiDynix needs to set for you, rather than a default table that ships with Horizon (can anyone confirm this?)
The circ_tran table contains (amongst other things) two very useful bits of information – the borrower# and the item# of the item they borrowed. You can use the item# to look up the bib# of that item (using the item table).
Once you’ve got the borrower# and bib#, you can use that to create two lists of data:
- a list of all the bib#s that a specific borrower has ever borrowed
- a list of all the borrower#s who have borrowed a specific bib#
To build the list of borrowing suggestions, you start with a bib# and:
- 1) build the list of all the borrower#s who have borrowed that bib#
- 2) for each of those borrower#s, compile all the bib#s of all the items they’ve borrowed to a single big list of bib#s
- 3) take that big list and count how many times each bib# appears in the list
- 4) sort your list of individual bib#s by the count of how many times they appear in the big list
…those bib#s that appear the most times in the big list are therefore the most appropriate ones to suggest.
Unfortunately those 4 steps can take some serious CPU time, so it’s not possible to do it on the fly as each of your patrons brings up a full bib page in HIP. Therefore, you need to pre-process each of your bib#s to generate a list of other suggested bib#s.
I wrote a Perl script this evening (which I’ll make available soon) that slurps up the entire circ_tran table into your PCs memory and then processes each of the bib#s to create up to 10 other suggested bib#s. Each of those suggestions is then pumped into a MySQL database where it will sit until a patron views that bib#s page in HIP.
A single line of JavaScript added to the fullnonmarcbib.xsl stylesheet then pulls in dynamic content from a Perl CGI script. That CGI script simply fetches the list of suggested bib#s from the MySQL database, quickly runs them via the title table in Horizon, and then displays a random selection of them underneath the copy/holding info:

The only real drawback is that it’s not working with your circ_tran data in real time – the list of 10 possible suggestions per bib# won’t change until I run the slurping Perl script again to rebuild all of the suggestions. On our database of 2,046,180 circ_tran entries, that took about 3 hours to process. So, in theory, you could schedule it to run once a week or once a month.